41.18 Arrests Map (Jan 2012 - May 2023)

An animated gif of each year of the map, from 2012-2022, along with percentages of arrests by race. For 2012-2018, there are a lot more total arrests and they are most concentrated in Downtown LA, Hollywood, and Venice. For 2019-2022, total arrests are down from previous years.  For 2012-2017, the percentage of those arrested who are Black is always between 40 to 50%. In 2018 the percentage of those arrested who are Black goes down each year. By 2022 Black people make up 19% of those arrested. From 2012-2017, White people make up about 30% of those arrested each year. Starting in 2018, White people makeup about 40% of those arrested each year. Hispanic/Latin people make up between 15-25% of those arrested each year from 2012-2019, and then arrests start rising in 2020 - they make up 38% of those arrested in 2022.  The areas that are most concentrated with the highest total arrests vary - in 2019 Skid Row and Venice have higher arrests. In 2020 Venice has higher arrests. In 2019 and 2020, West Los Angeles has higher arrests. In 2020, Chatsworth and Westlake-MacArthur Park have higher arrests too.  The Source of Data is LAPD.

Click Here to Open the Map

This map shows details of arrests under LA Municipal Code 41.18,
which criminalizes sitting, lying, & sleeping, or placing personal property in the public right-of-way in certain instances.


Summary and Analysis
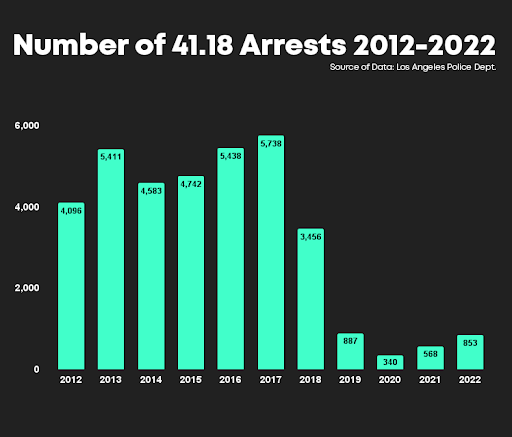


A bar chart showing the number of 41.18 arrests 2012-2022. 2012-2018 are all in the thousands. 2017 is the highest bar, showing 5,738 arrests. 2019-2022 show much lower numbers than previous years - these numbers are in the hundreds. Arrests in 2020 are the lowest, at 340, and have been rising each year since. 2021 had 568 arrests, and 2022 had 853 arrests. The source of data is the Los Angeles Police Department.


From 2012-2022, LAPD made over 36,000 41.18 arrests.

📅 Average arrests/year:
2012-2018: 4,781
2019-2022: 662

The drop in arrests followed the 2018 court ruling in the case
Martin v. Boise, barring cities from enforcing anti-camping laws without offering adequate shelter.

A donut chart of 41.18 Arrests by Race. The largest segment is Black, at 42.5%, or 15,654 arrests. The second largest segment is White, at 34.0%, or 12,495 arrests. 3rd largest is Hispanic/Latin, at 20.5% or 7,552 arrests. Other is 2.4% at 887 arrests. Asian is 0.5% at 198 arrests. American Indian/Alaskan Native is 0.0% at 9 arrests. Pacific Islander is 0.0% at 4 arrests. The source of data and race categories are by the Los Angeles Police Department.

41.18 Arrests by Race:
Black: 43%
White: 34%
Hispanic/Latin: 21%
Other: 2%

LA Population by Race:
Black: 8%
White: 29%
Hispanic/Latin: 48%
Other: 15%


43% of those arrested were Black.
Black people are only 8% of the general population of the City of LA.


Bar Chart of 41.18 Arrests by Council District, Jan 2012 to May 2023. There are 15 council districts. Three Council Districts show substantially taller bars than the other 12 Council Districts. Of the three highest bars: Council District 14 has by far the tallest bar, representing 18,972 arrests. Council District 11 has 5,961 arrests, and CD13 has 5,206 arrests. All 12 other council districts have fewer than 1000 arrests. Source of Data is LAPD.


41.18 Arrests by Council District:

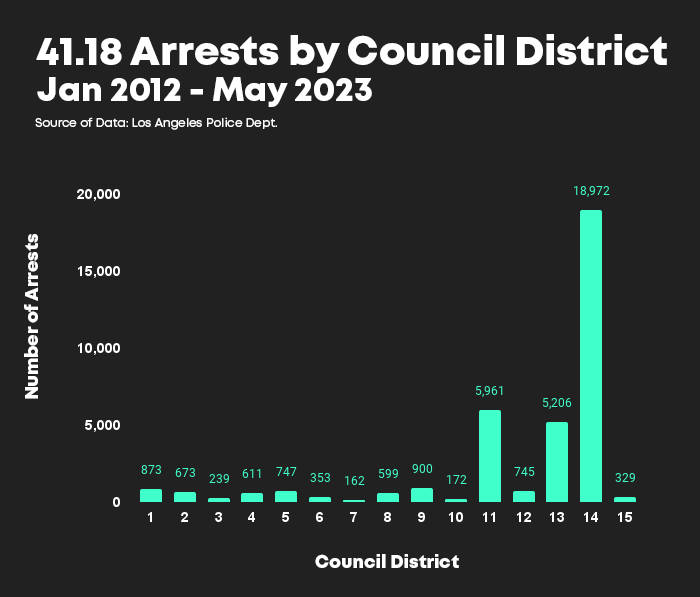
Over 50% of 41.18 arrests were in Council District 14 (includes Skid Row, DTLA).


16% of arrests were in CD11 (includes Venice), and 14% of arrests were in CD13 (includes Hollywood).


All other Council Districts had less than 3% of arrests each.
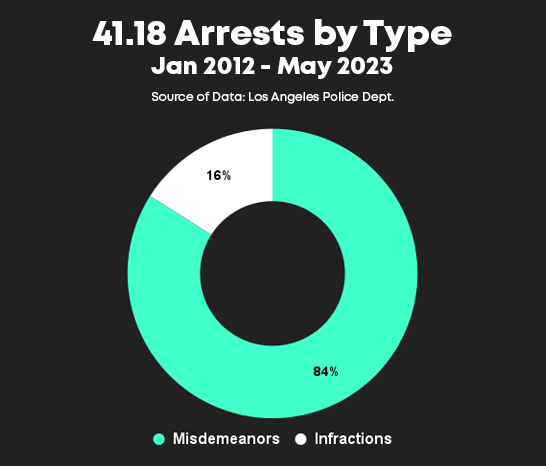

Donut Chart of 41.18 Arrests by Type, Jan 2012-May 2023. It shows 84% Misdemeanors and 16% Infractions. Source of Data is LAPD.


41.18 Arrests by Type:
Misdemeanors: 84%
Infractions: 16%


41.18 violations can be cited as either infractions or misdemeanors.
Infractions can lead to a fine of up to $2,500.
Misdemeanors can result in a fine plus up to 6 months in jail.


Donut Chart of 41.18 Arrests by Sex, Jan 2012-May 2023. It shows 73% Male and 27% Female. Source of Data is LAPD.

41.18 Arrests by Sex:
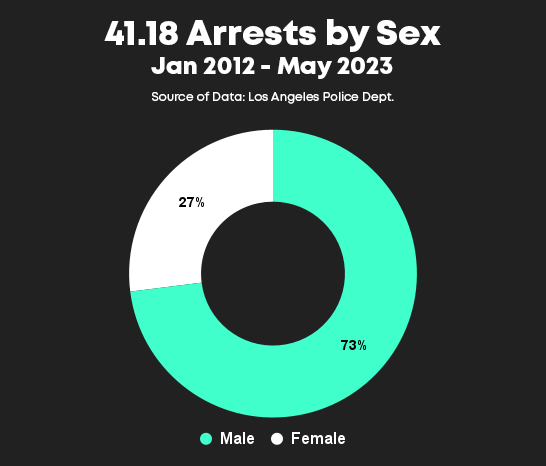
73% of those arrested were male.
27% were female.

The general population of the City of LA is 49% male and 51% female.