LAPD Arrest Maps & Analysis (2019-22)

Traducción en Español

An animated gif of the map, showing each year, 2019 through 2022. Arrests appear to decrease significantly between 2019 and 2020, and then further decrease slightly each year over the following years.

This map shows locations and details of the nearly 300,000 arrests the Los Angeles Police Department made between 2019 and 2022.

Users can navigate the map and filter by race, Council District, LAPD Division, and arrest type.

The data was obtained from the Los Angeles Police Department, but marks the first time the data has been made accessible and mapped for the public without limitations.


Arrests are triggered by allegations of criminal acts that may or may not have occurred.


Click Here to Open the Map

Summary and Analysis


Race

A bar chart of LAPD Arrests by Race, 2019-2022. The tallest bar is Hispanic/Latino, at 51%. Next is Black, at 27%, then White at 16%, then Other at 5%. Total arrests for each of the following 4 race categories are not more than 0%: Asian, Pacific Islander, Unknown, and American Indian/Alaskan Native. The Source of Data is LAPD.A bar chart of Los Angeles Population by Race.  Hispanic/Latino is 48%.  Black is 8%. White is 29%. Other is 0%.  Asian is 12%, Pacific Islander is 0%, 2+ races is 3%, and American Indian/Alaskan Native is 0%. Source of Data is American Community Survey, 2021 5-Year Estimate.

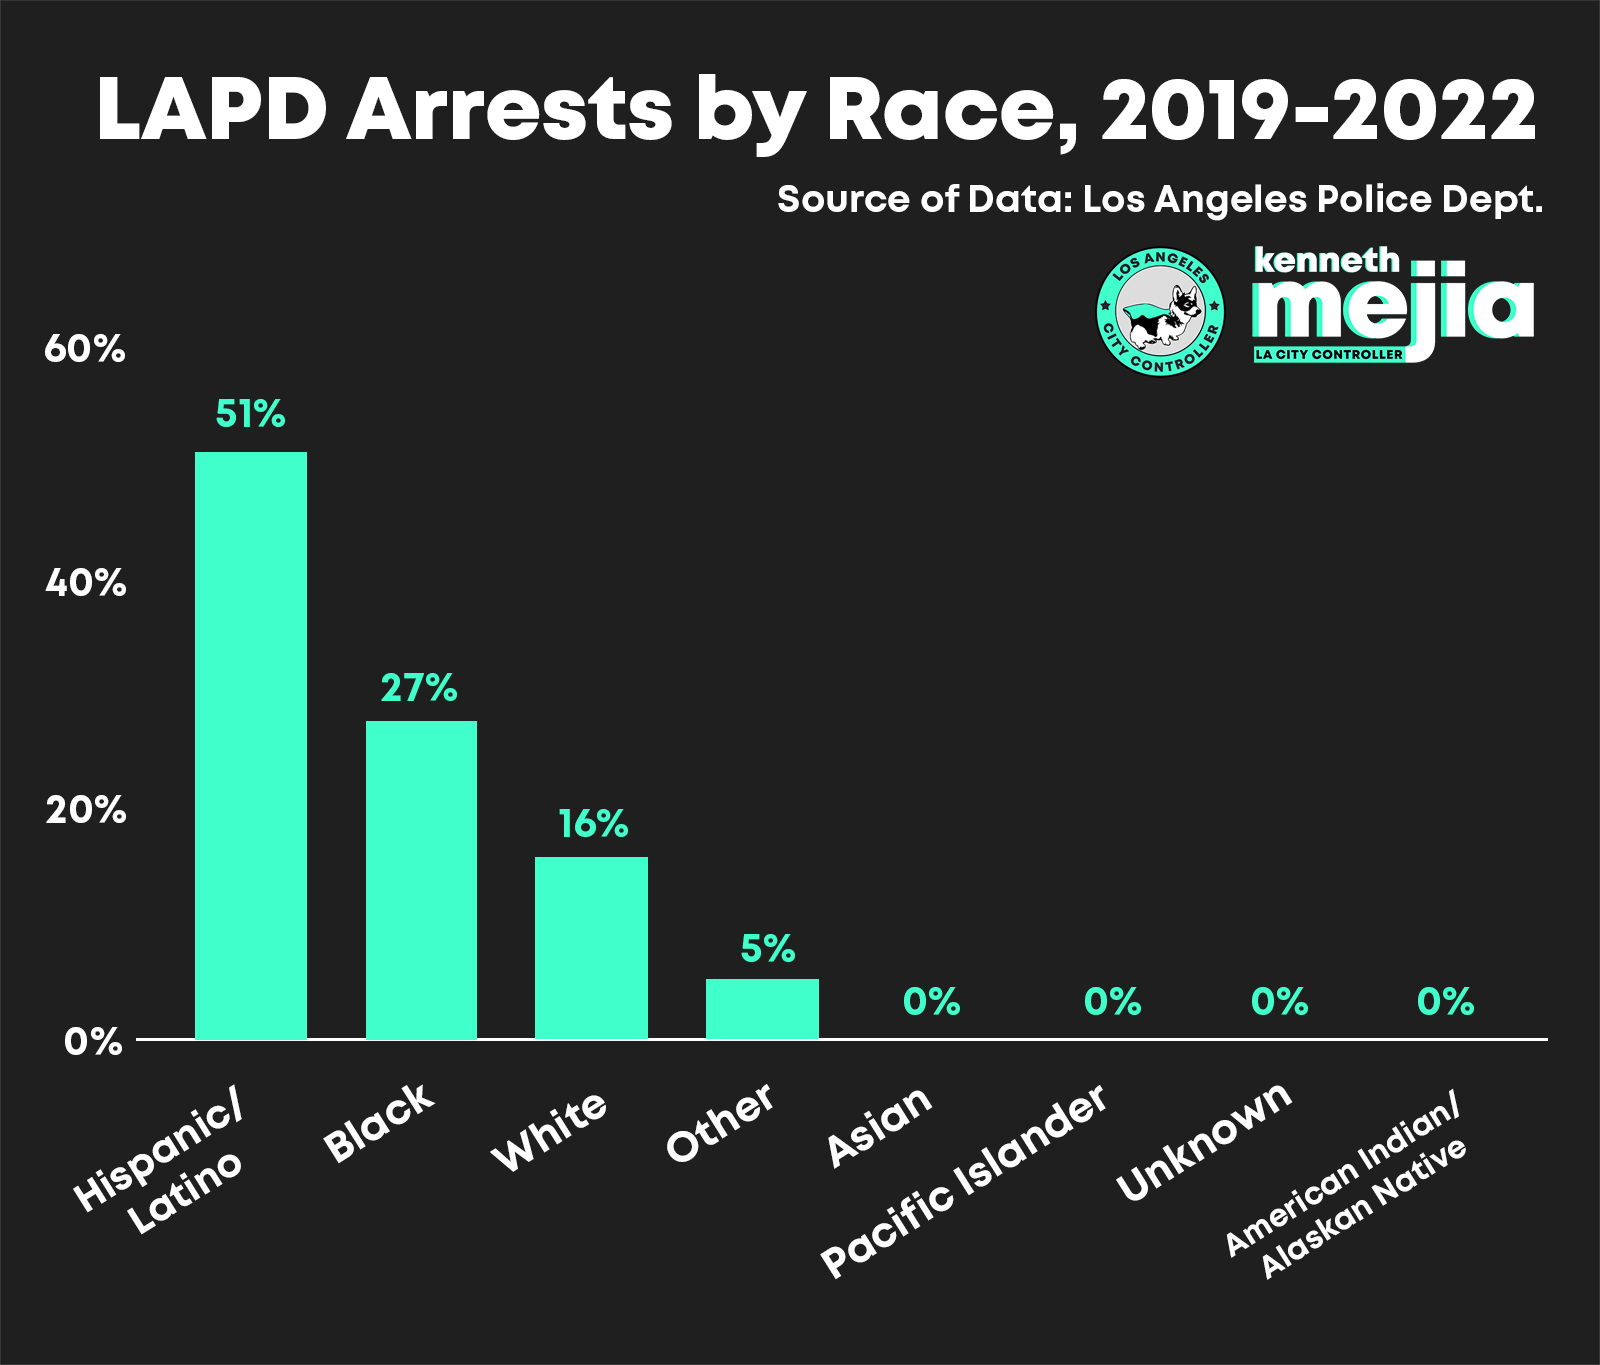
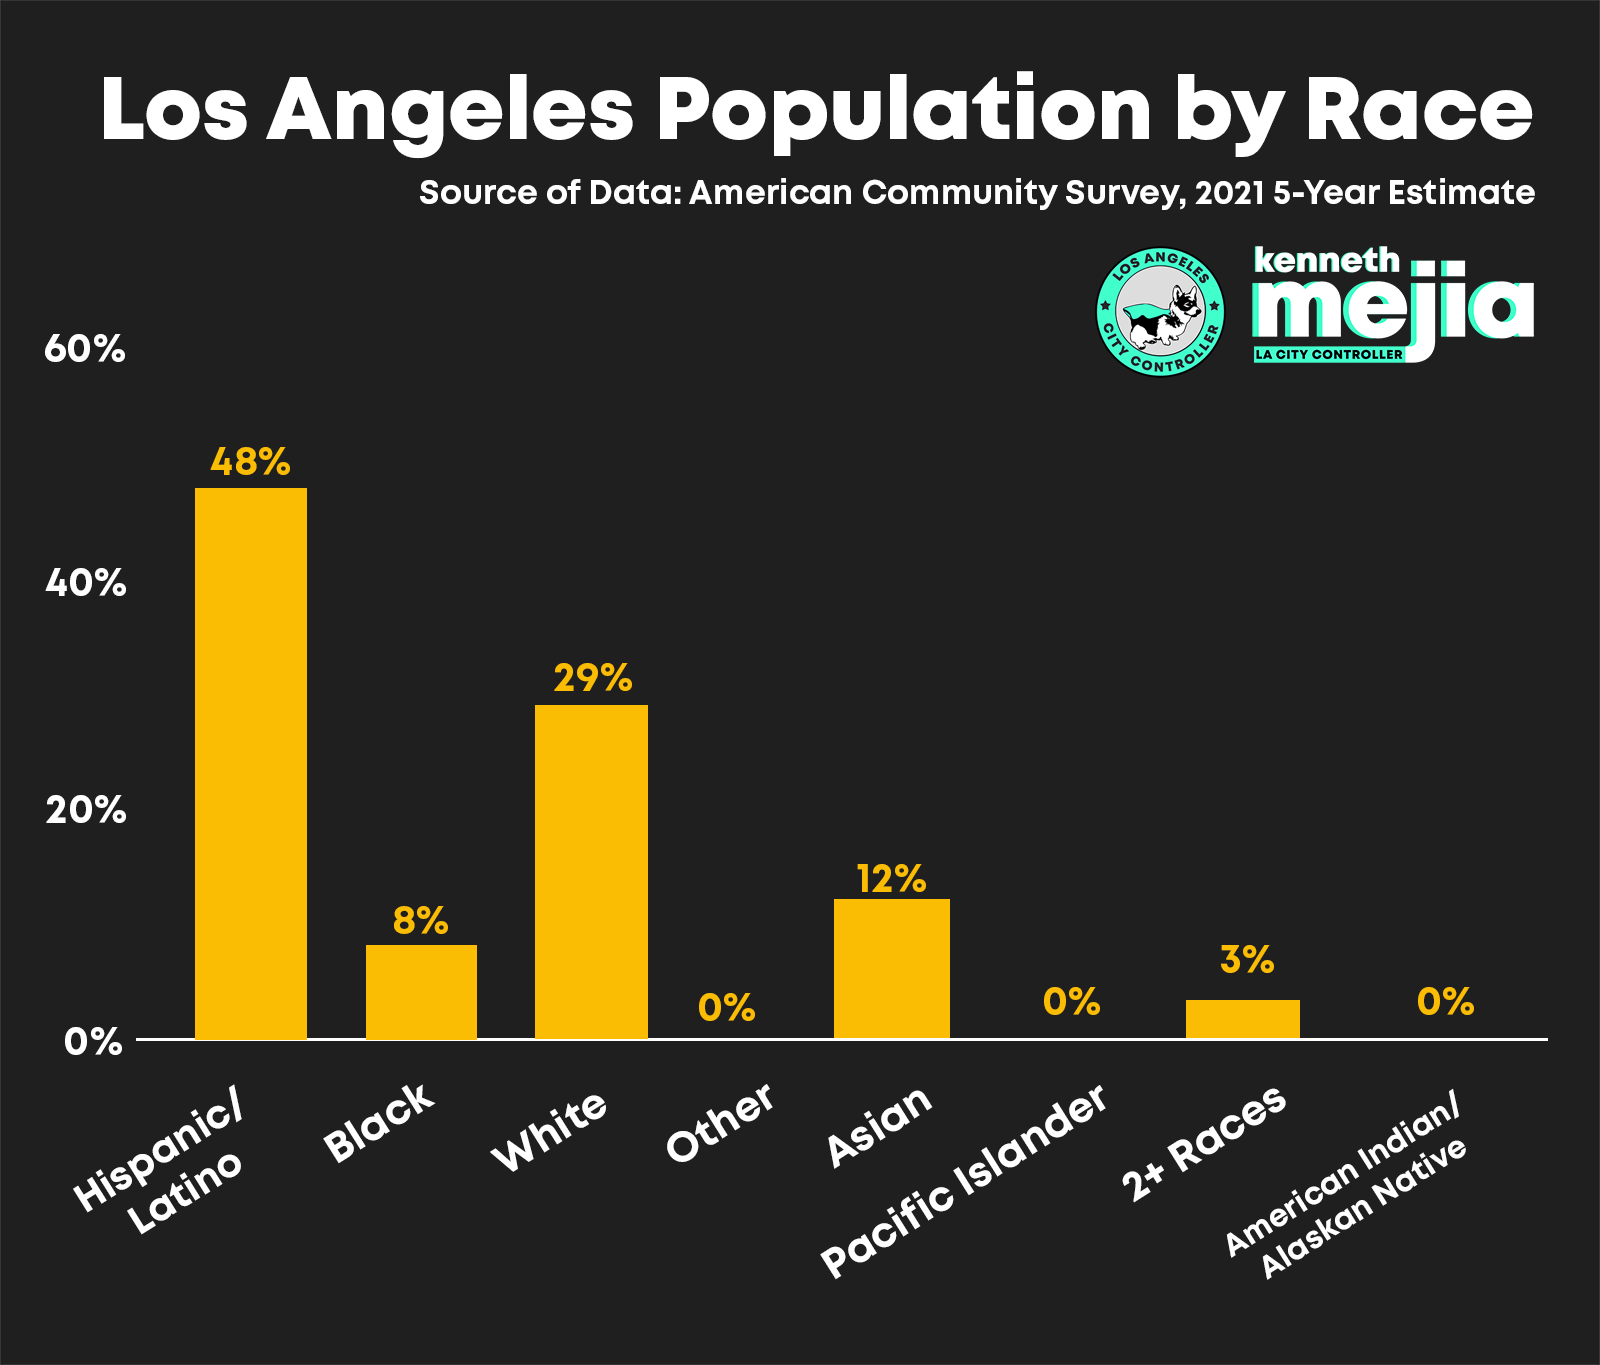
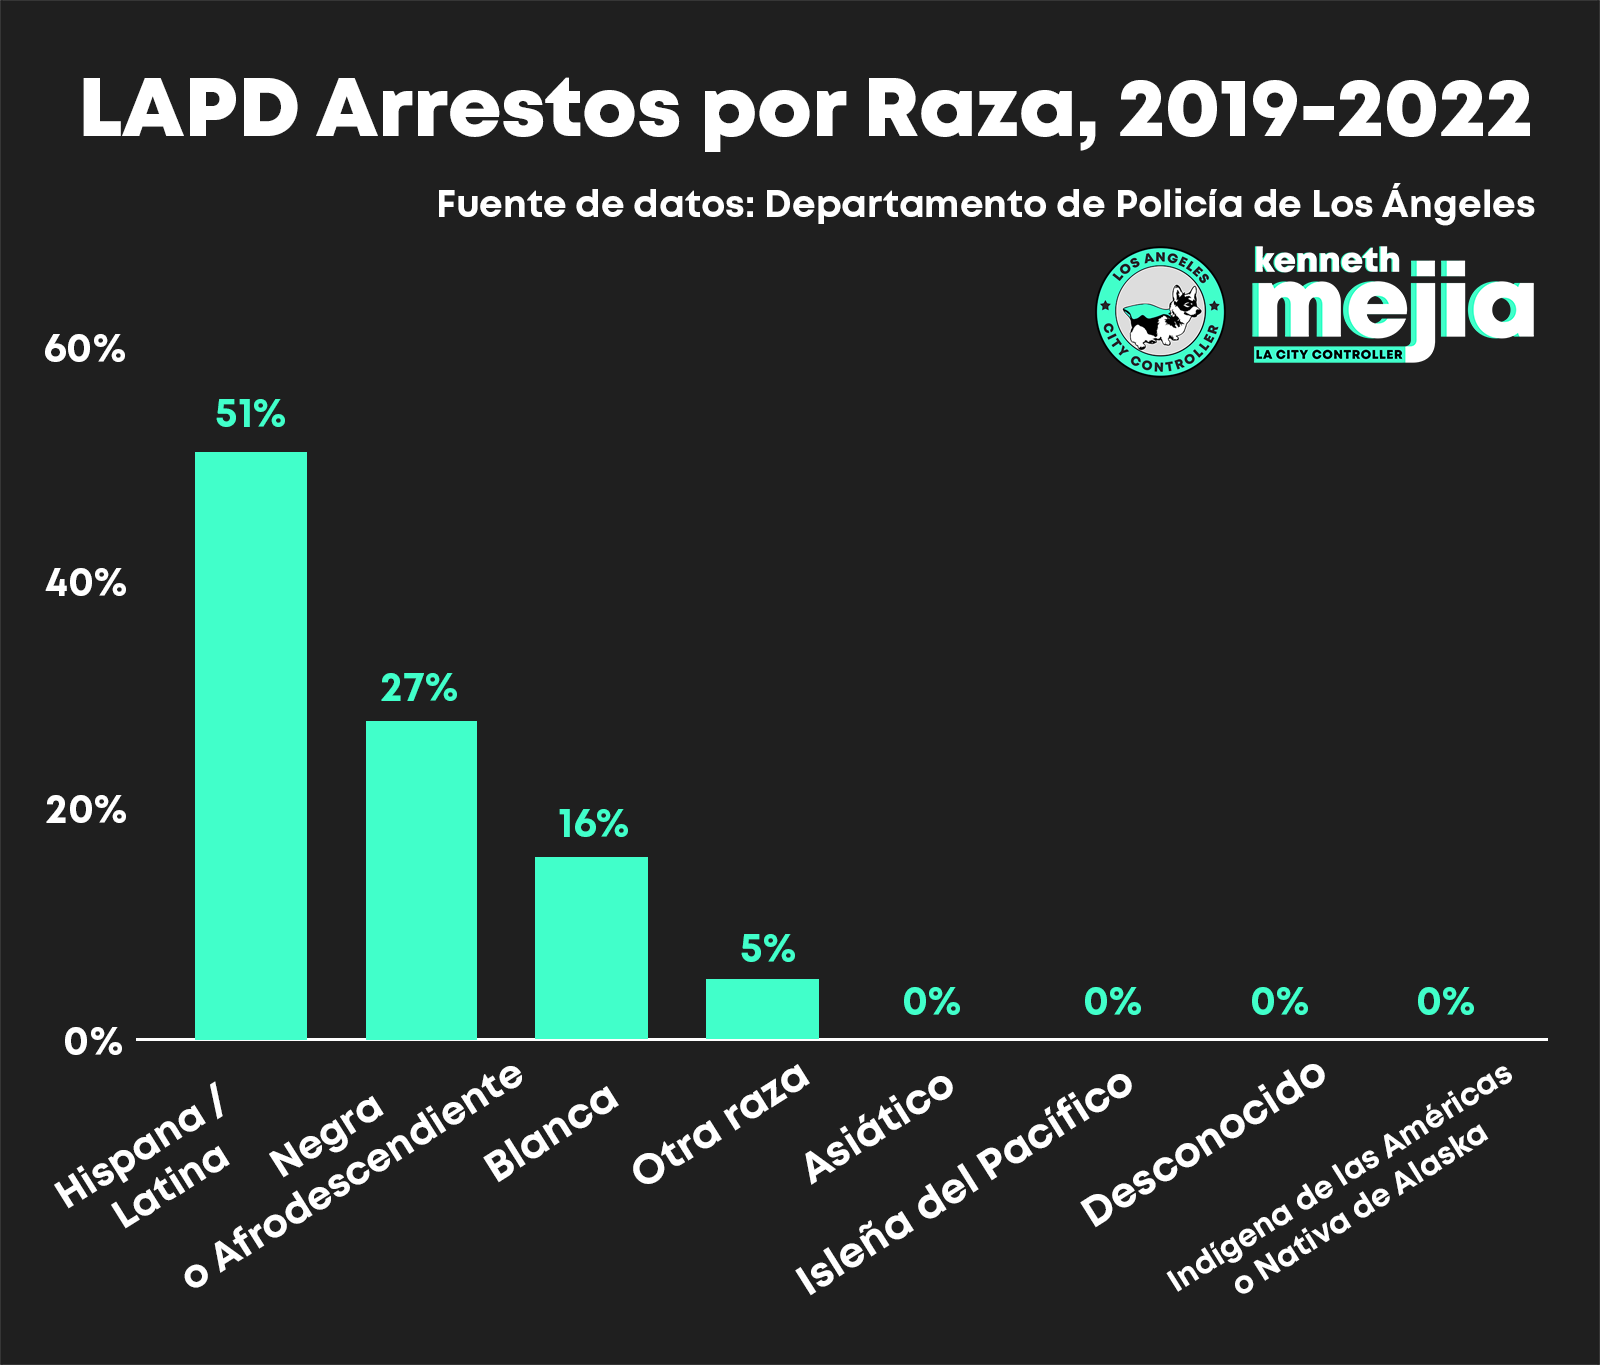
As the map highlights, Brown and Black people are arrested at a disproportionate rate,
making up an average of 78.26% of all arrests over the past four years (2019-2022)
despite being only 56% of the LA City population according to 2020 Census data.


  • Brown & Black people = 78.26% of all arrests from 2019-2022
  • Brown & Black people = 56% of the LA City population (per 2020 Census data)
A bar chart of LAPD Arrests by Council District, 2019. There are 15 Council Districts. Council District 14 has a much higher number of arrests than any other district, with around 14,000 arrests. There are several other Council Districts with around 7,000 to 9,000 arrests (CDs 1, 6, 8, 9, 13), The rest of the Council Districts have fewer than around 5,000 to 6,000 arrests. CDs 5 and 12 in particular have the fewest number of arrests, at around 2,500 arrests each. Source of data is LAPD.A bar chart of LAPD Arrests by Council District, 2020. There are fewer arrests overall compared to 2019. There are 15 Council Districts. Council District 14 has the highest number of arrests, at around 7,500 arrests,  but is also fairly close in number of arrests to districts 8 and 9, which are around 6,000 arrests.  CDs 1, 6, 10, 11, and 13 each have around 5,000 arrests. The rest of the Council Districts have much fewer than 5,000  arrests. CDs 5 and 12 have the fewest number of arrests, at under 2,500 arrests each. Source of data is LAPD.
A bar chart of LAPD Arrests by Council District, 2021. There are still fewer arrests overall compared to 2019. There are 15 Council Districts. Council Districts  8 and 14 have the highest number of arrests, at around 6,000  arrests,  and are also fairly close in number of arrests to districts 9, and 11 which are also close to 6,000 arrests.  CDs 1, 6, and 13 each have around 5,000 arrests. The rest of the Council Districts havemuch fewer than 5,000  arrests. CDs 5 and 12 again have the fewest number of arrests, at under 2,500 arrests each. Source of data is LAPD.A bar chart of LAPD Arrests by Council District, 2022. There are still fewer arrests overall compared to 2019. There are 15 Council Districts. Council Districts 14, 8, and 1 have the highest number of arrests, at around 5,000 to 6,000  arrests,  and are also fairly close in number of arrests to districts 6, 9,  11, and 13 which are also close to 5,000 arrests. The rest of the Council Districts havemuch fewer than 5,000  arrests. CDs 4 and 5 have the fewest number of arrests, at under 2,500 arrests each. Source of data is LAPD.

Council Districts

A bar chart of LAPD Arrests by Council District, 2019. There are 15 Council Districts. Council District 14 has a much higher number of arrests than any other district, with around 14,000 arrests. There are several other Council Districts with around 7,000 to 9,000 arrests (CDs 1, 6, 8, 9, 13), The rest of the Council Districts have fewer than around 5,000 to 6,000 arrests. CDs 5 and 12 in particular have the fewest number of arrests, at around 2,500 arrests each. Source of data is LAPD.A bar chart of LAPD Arrests by Council District, 2020. There are fewer arrests overall compared to 2019. There are 15 Council Districts. Council District 14 has the highest number of arrests, at around 7,500 arrests,  but is also fairly close in number of arrests to districts 8 and 9, which are around 6,000 arrests.  CDs 1, 6, 10, 11, and 13 each have around 5,000 arrests. The rest of the Council Districts have much fewer than 5,000  arrests. CDs 5 and 12 have the fewest number of arrests, at under 2,500 arrests each. Source of data is LAPD.
A bar chart of LAPD Arrests by Council District, 2021. There are still fewer arrests overall compared to 2019. There are 15 Council Districts. Council Districts  8 and 14 have the highest number of arrests, at around 6,000  arrests,  and are also fairly close in number of arrests to districts 9, and 11 which are also close to 6,000 arrests.  CDs 1, 6, and 13 each have around 5,000 arrests. The rest of the Council Districts havemuch fewer than 5,000  arrests. CDs 5 and 12 again have the fewest number of arrests, at under 2,500 arrests each. Source of data is LAPD.A bar chart of LAPD Arrests by Council District, 2022. There are still fewer arrests overall compared to 2019. There are 15 Council Districts. Council Districts 14, 8, and 1 have the highest number of arrests, at around 5,000 to 6,000  arrests,  and are also fairly close in number of arrests to districts 6, 9,  11, and 13 which are also close to 5,000 arrests. The rest of the Council Districts havemuch fewer than 5,000  arrests. CDs 4 and 5 have the fewest number of arrests, at under 2,500 arrests each. Source of data is LAPD.

For almost every year, Council District 14 leads all other districts for the total number of arrests. In 2021,
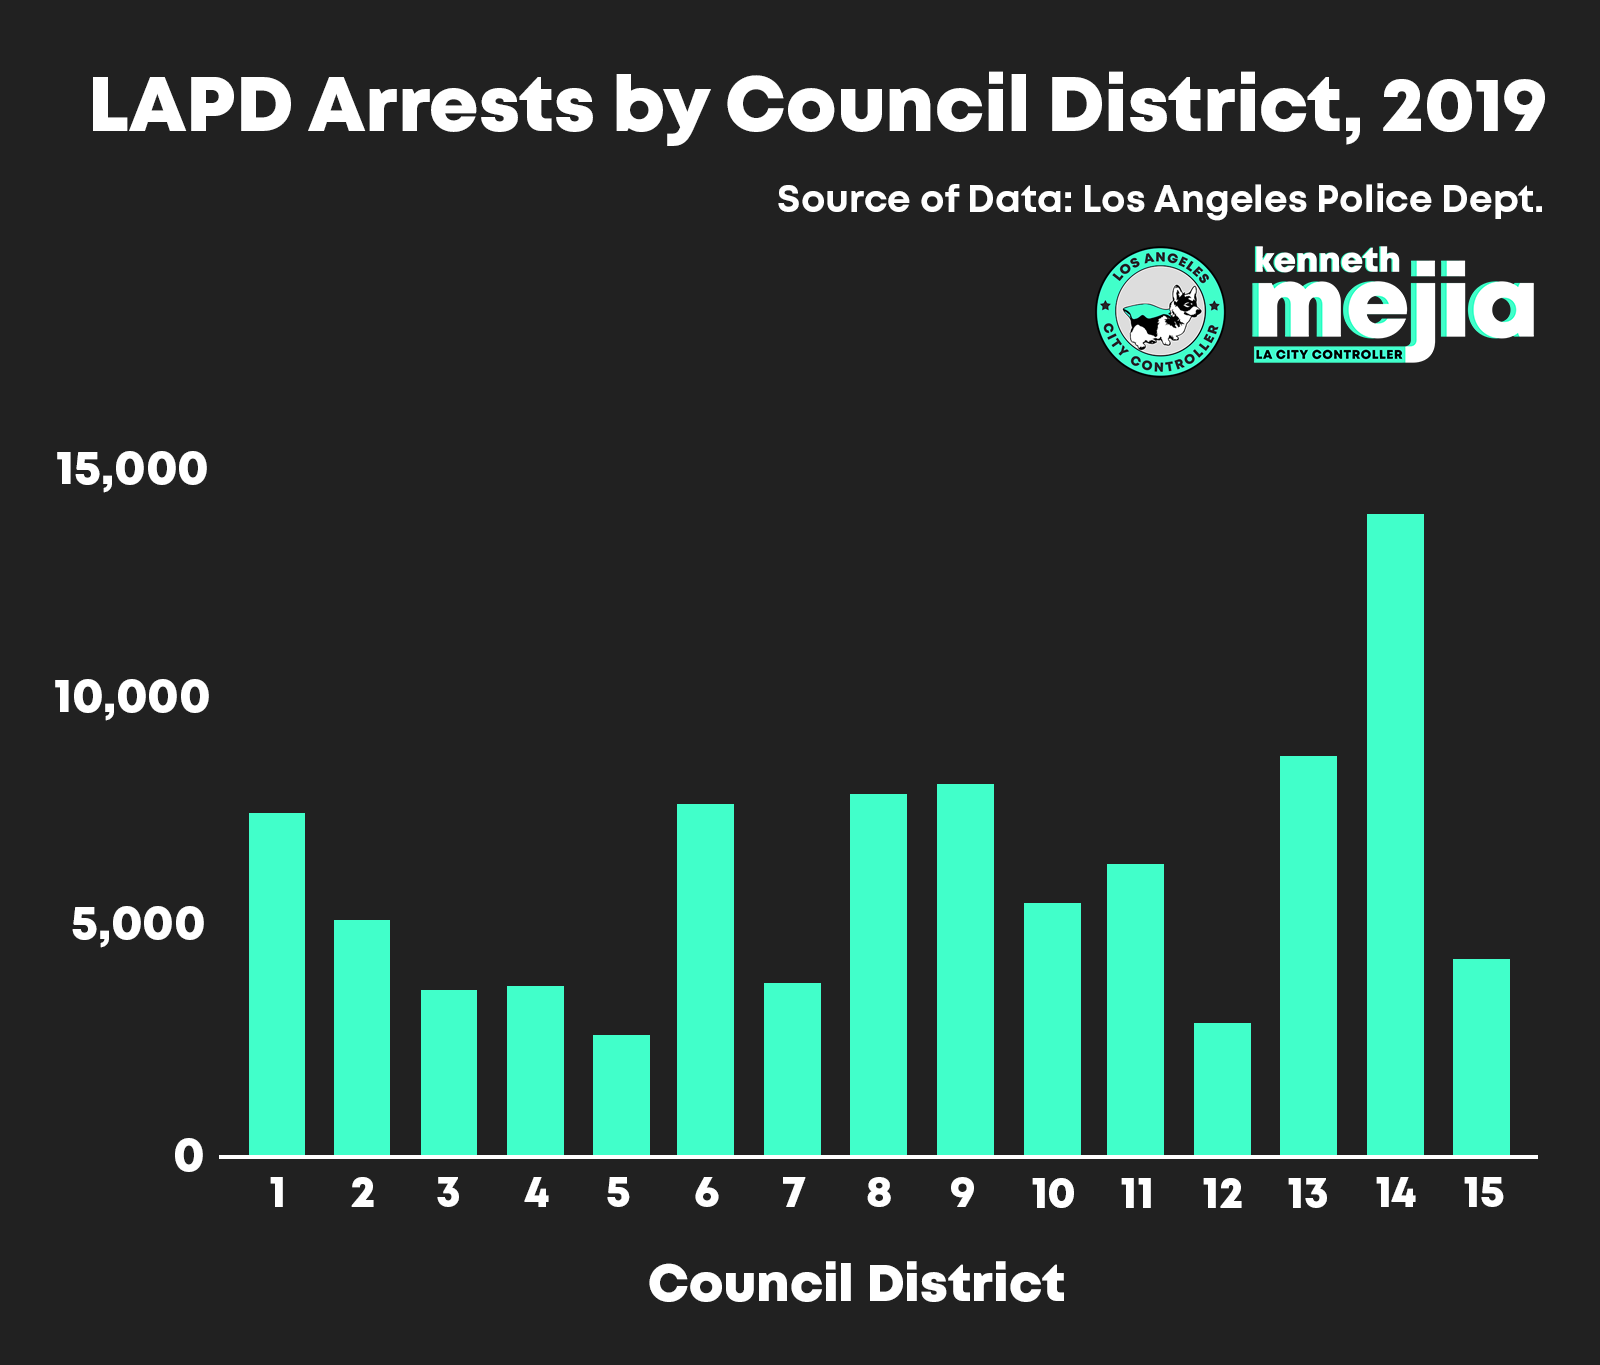
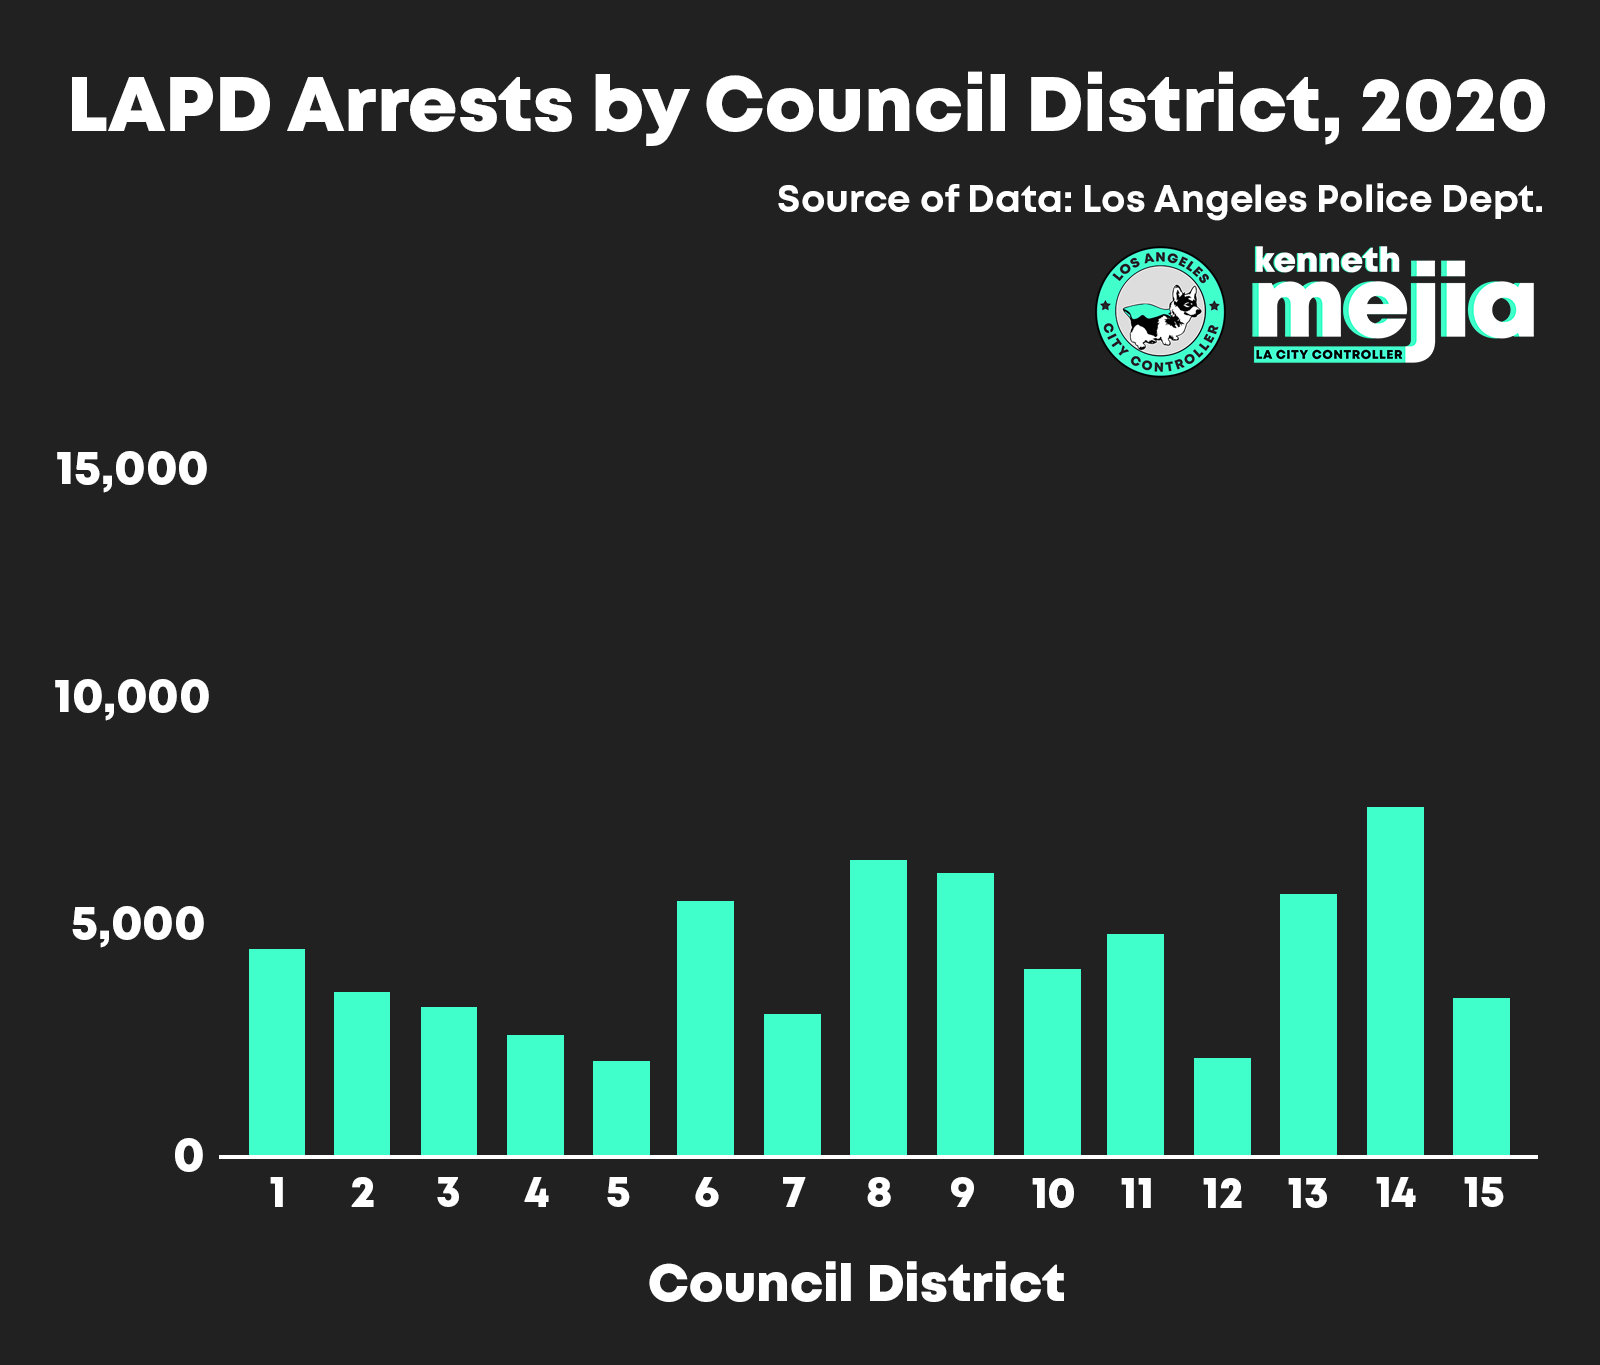
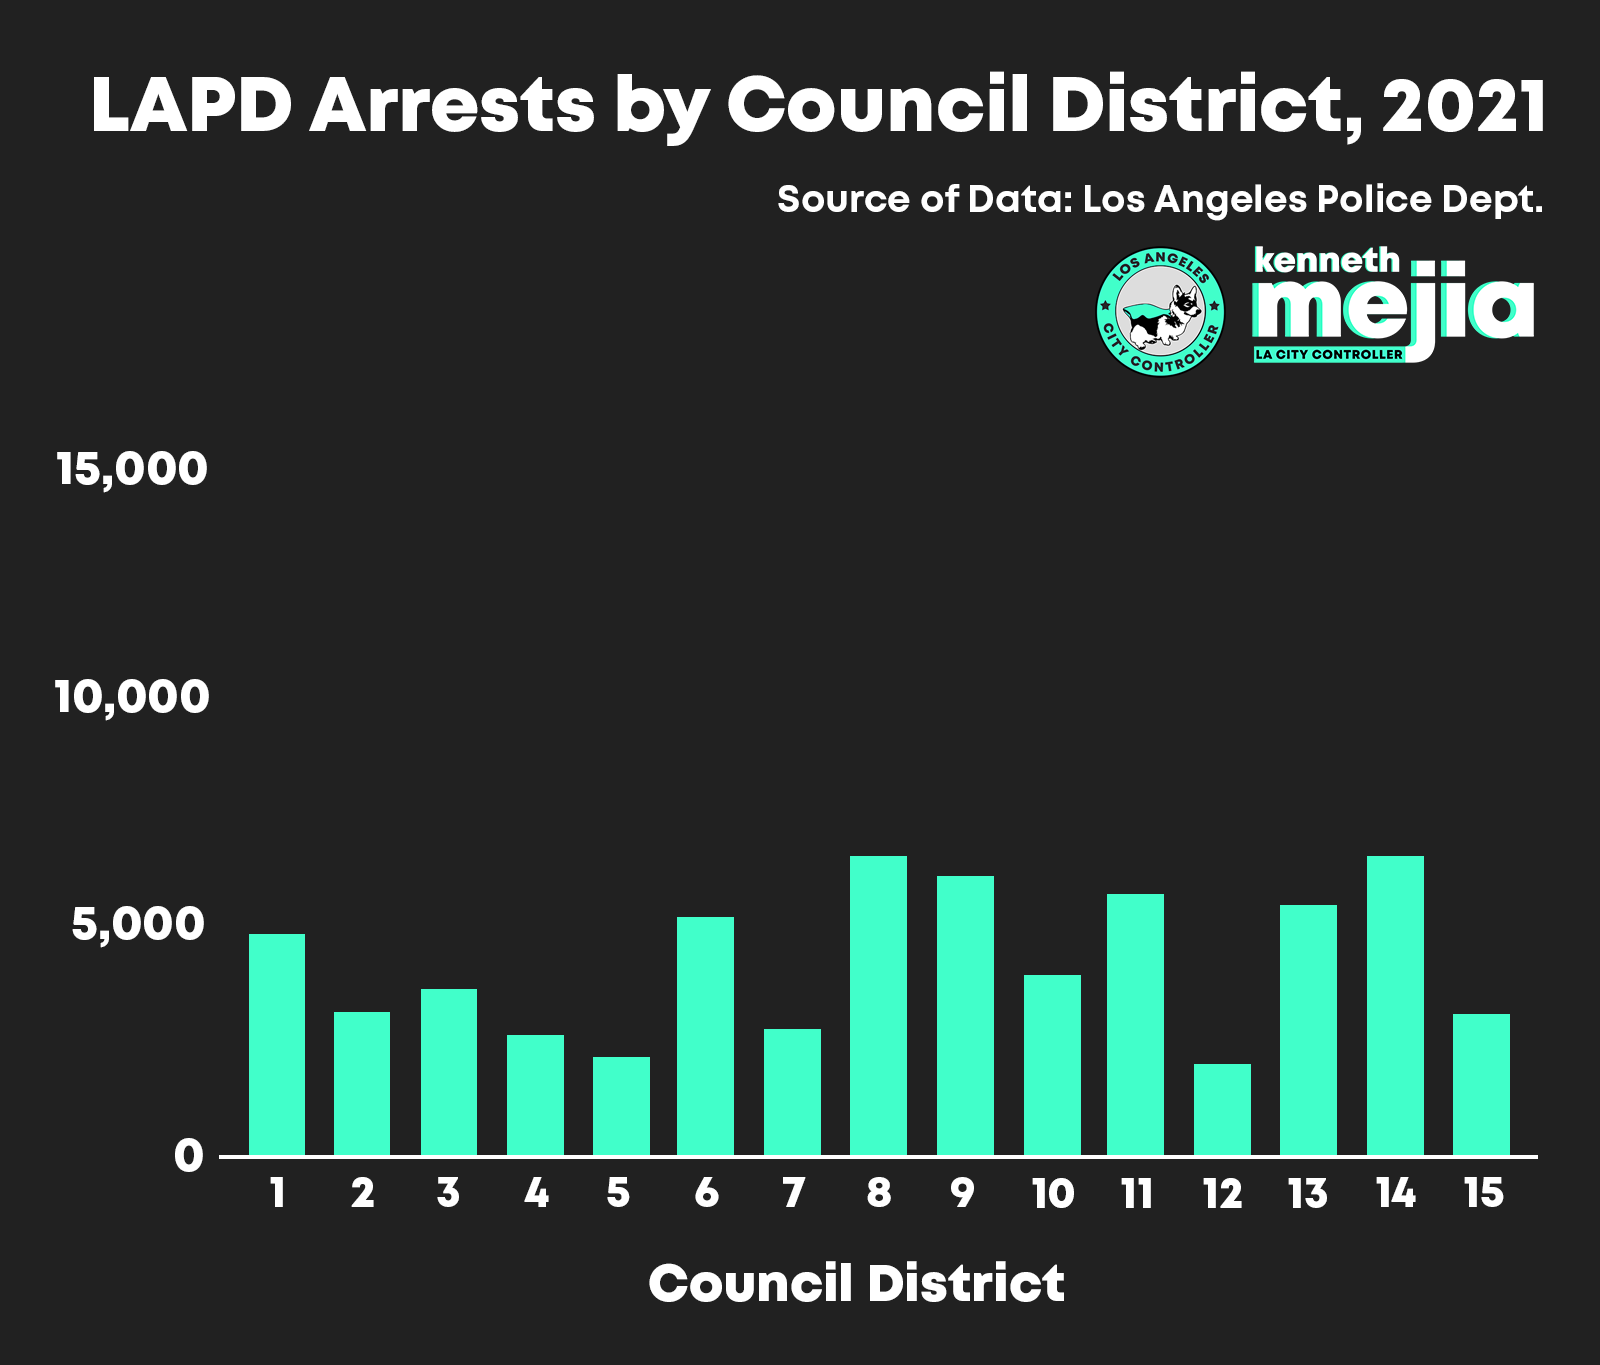
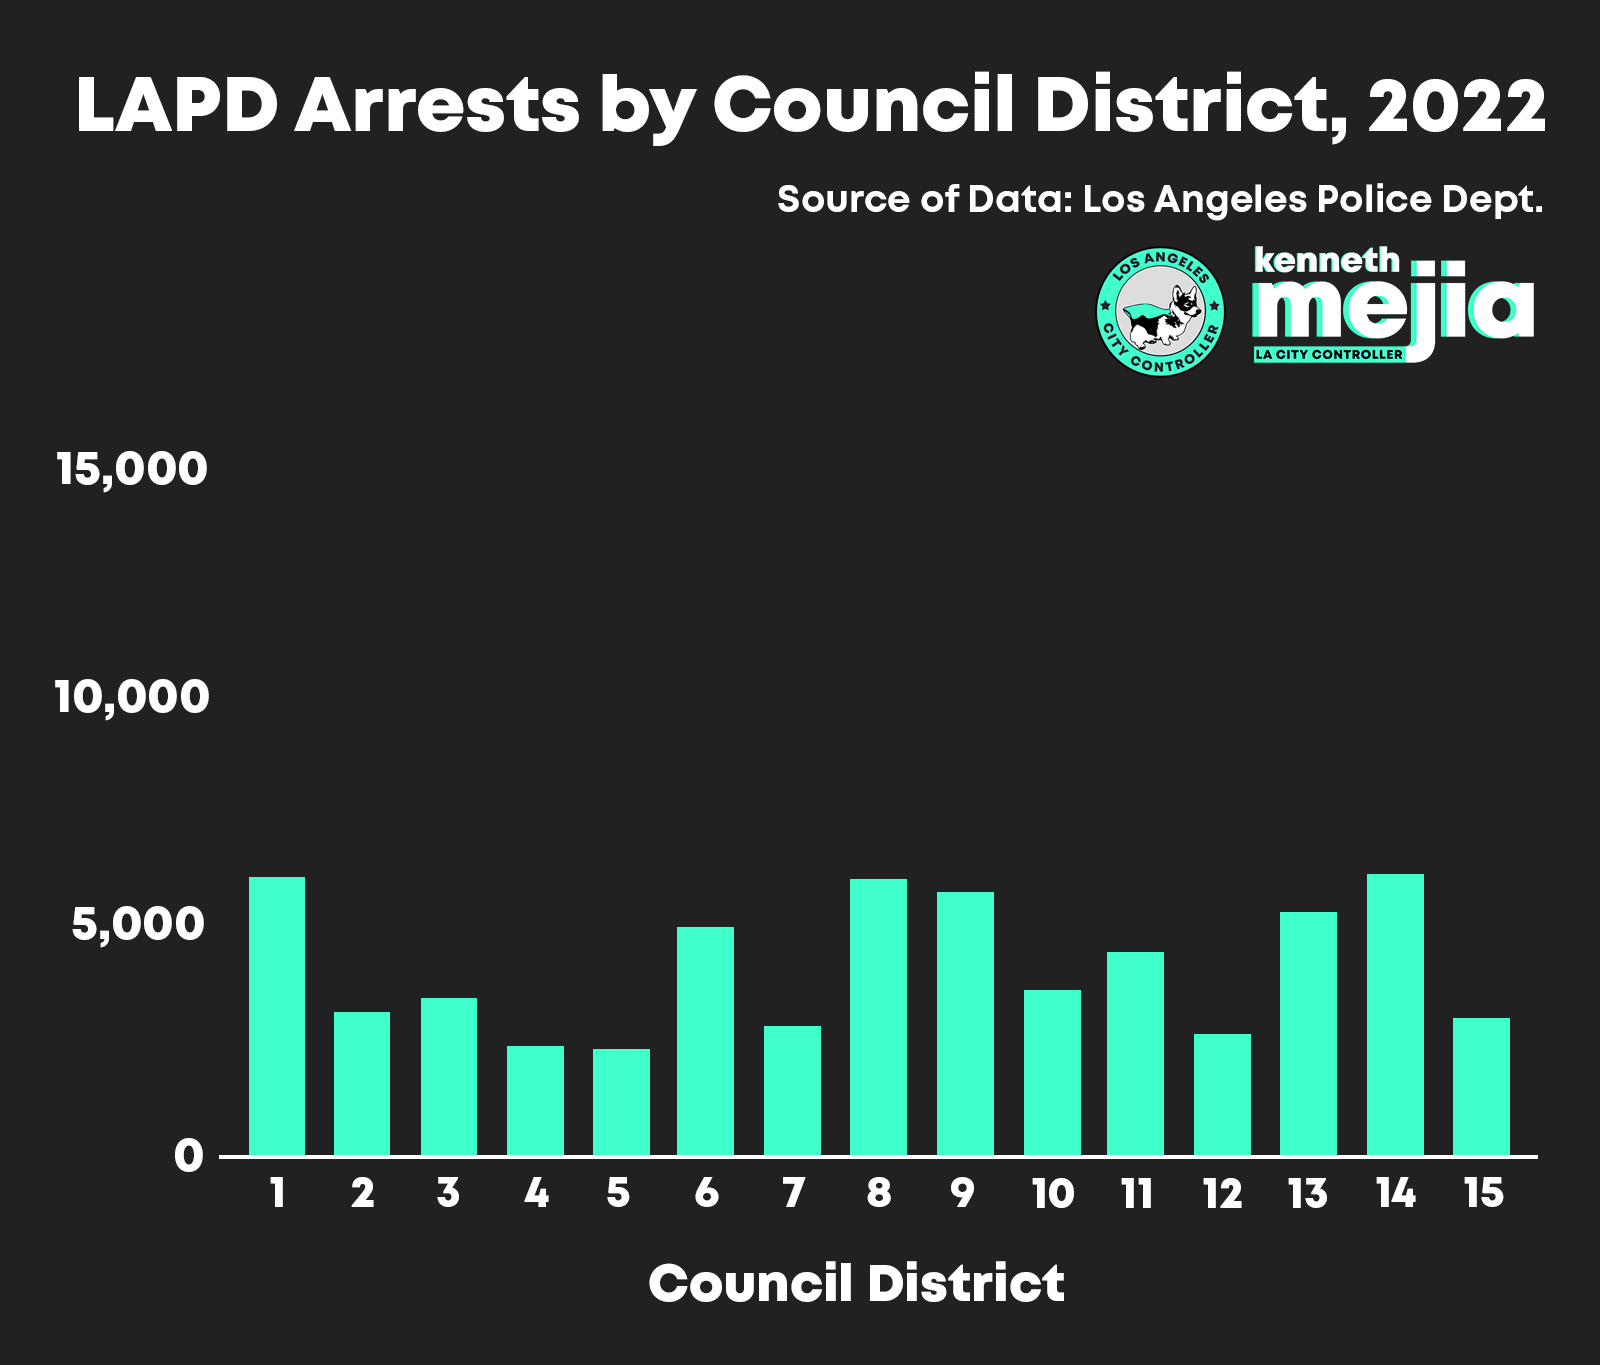
it came in second to Council District 8 by a difference of only three arrests.


Arrest Type

A bar chart of LAPD Arrests by Council District, 2019. There are 15 Council Districts. Council District 14 has a much higher number of arrests than any other district, with around 14,000 arrests. There are several other Council Districts with around 7,000 to 9,000 arrests (CDs 1, 6, 8, 9, 13), The rest of the Council Districts have fewer than around 5,000 to 6,000 arrests. CDs 5 and 12 in particular have the fewest number of arrests, at around 2,500 arrests each. Source of data is LAPD.A bar chart of LAPD Arrests by Council District, 2020. There are fewer arrests overall compared to 2019. There are 15 Council Districts. Council District 14 has the highest number of arrests, at around 7,500 arrests,  but is also fairly close in number of arrests to districts 8 and 9, which are around 6,000 arrests.  CDs 1, 6, 10, 11, and 13 each have around 5,000 arrests. The rest of the Council Districts have much fewer than 5,000  arrests. CDs 5 and 12 have the fewest number of arrests, at under 2,500 arrests each. Source of data is LAPD.
A bar chart of LAPD Arrests by Council District, 2021. There are still fewer arrests overall compared to 2019. There are 15 Council Districts. Council Districts  8 and 14 have the highest number of arrests, at around 6,000  arrests,  and are also fairly close in number of arrests to districts 9, and 11 which are also close to 6,000 arrests.  CDs 1, 6, and 13 each have around 5,000 arrests. The rest of the Council Districts havemuch fewer than 5,000  arrests. CDs 5 and 12 again have the fewest number of arrests, at under 2,500 arrests each. Source of data is LAPD.A bar chart of LAPD Arrests by Council District, 2022. There are still fewer arrests overall compared to 2019. There are 15 Council Districts. Council Districts 14, 8, and 1 have the highest number of arrests, at around 5,000 to 6,000  arrests,  and are also fairly close in number of arrests to districts 6, 9,  11, and 13 which are also close to 5,000 arrests. The rest of the Council Districts havemuch fewer than 5,000  arrests. CDs 4 and 5 have the fewest number of arrests, at under 2,500 arrests each. Source of data is LAPD.

The LAPD arrest types fall into five categories identified by the LAPD:
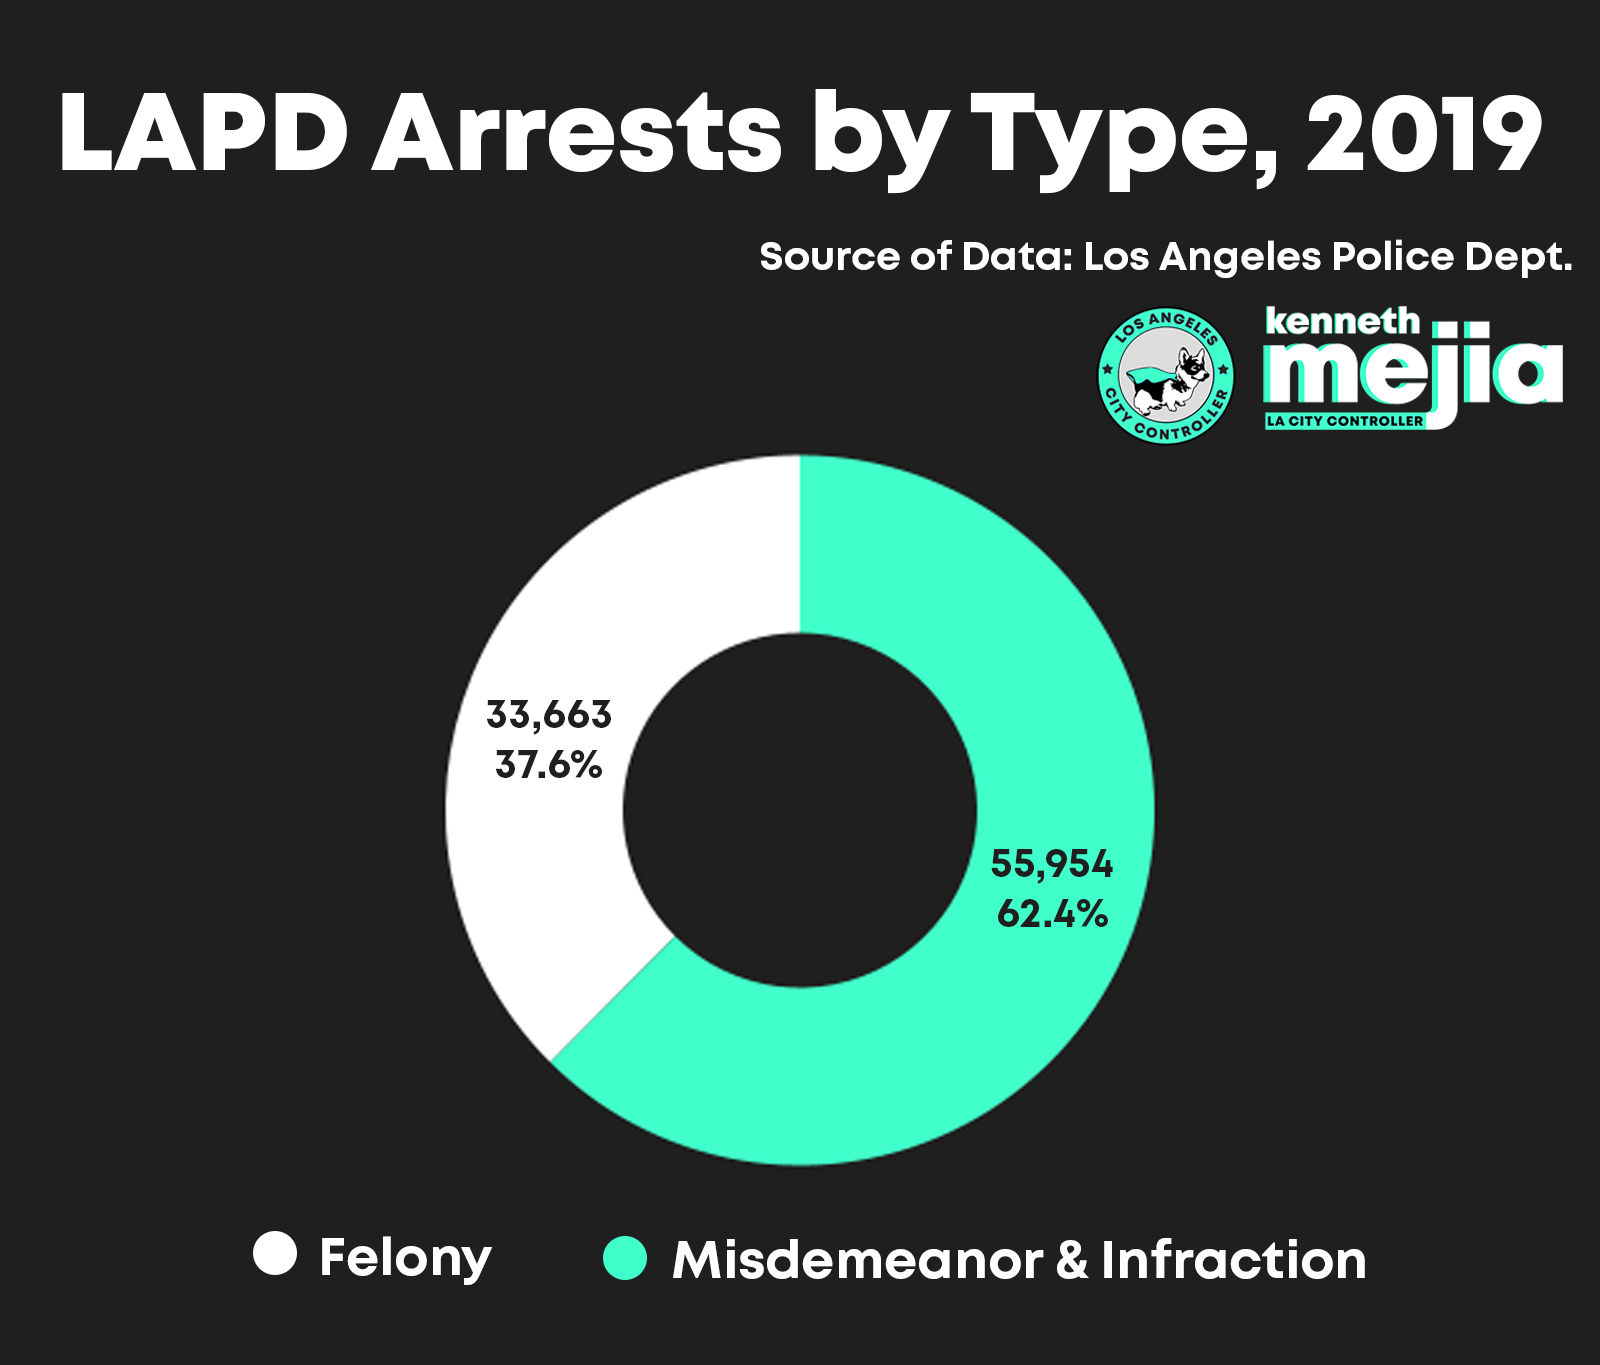
(1) felony, (2) misdemeanor, (3) infractions, (4) dependent, and (5) other.

Under California law, a felony is a crime that is punishable with death, by imprisonment in the state prison,
or . . . by imprisonment in a county jail under [certain provisions]. Every other crime or public offense is a misdemeanor except those offenses that are classified as infractions.
Misdemeanors and infractions carry varying degrees of financial and incarceration consequences.


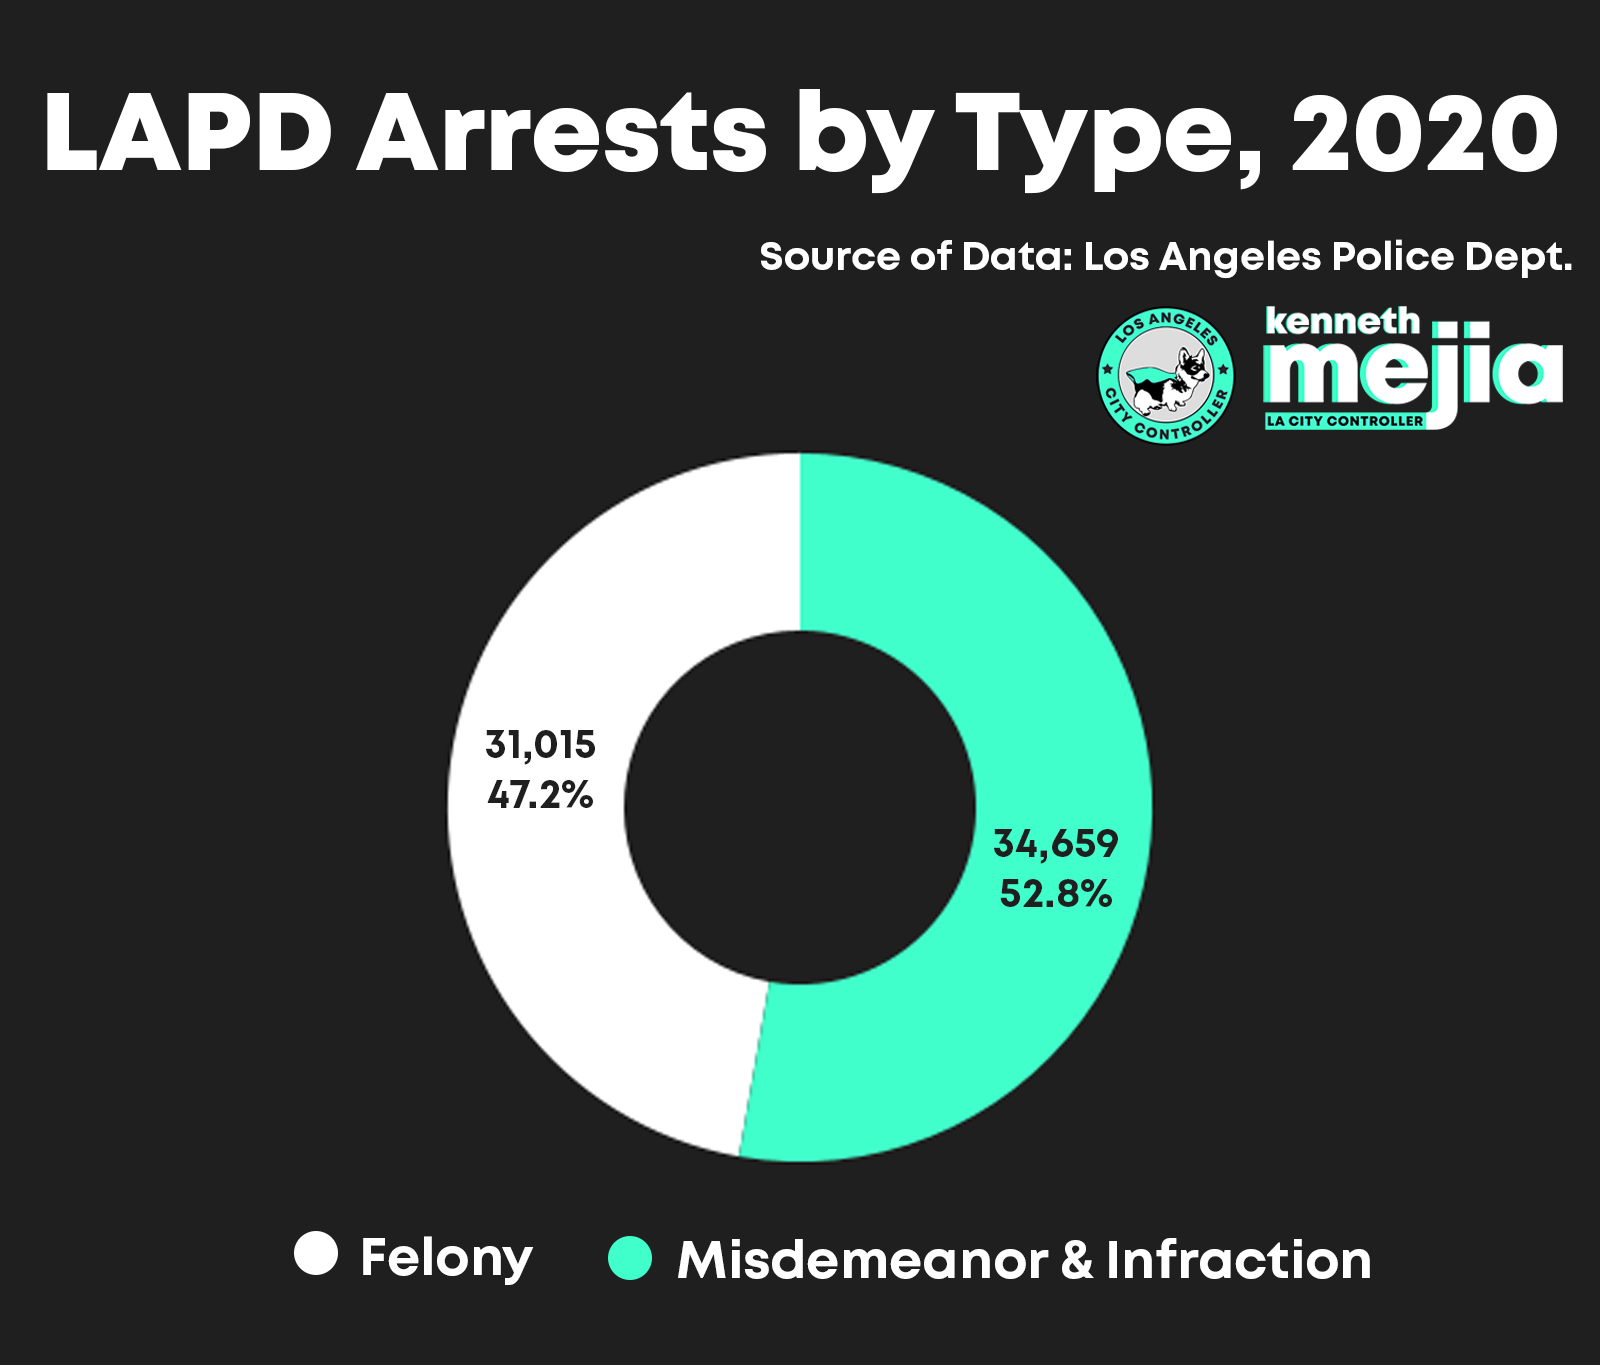
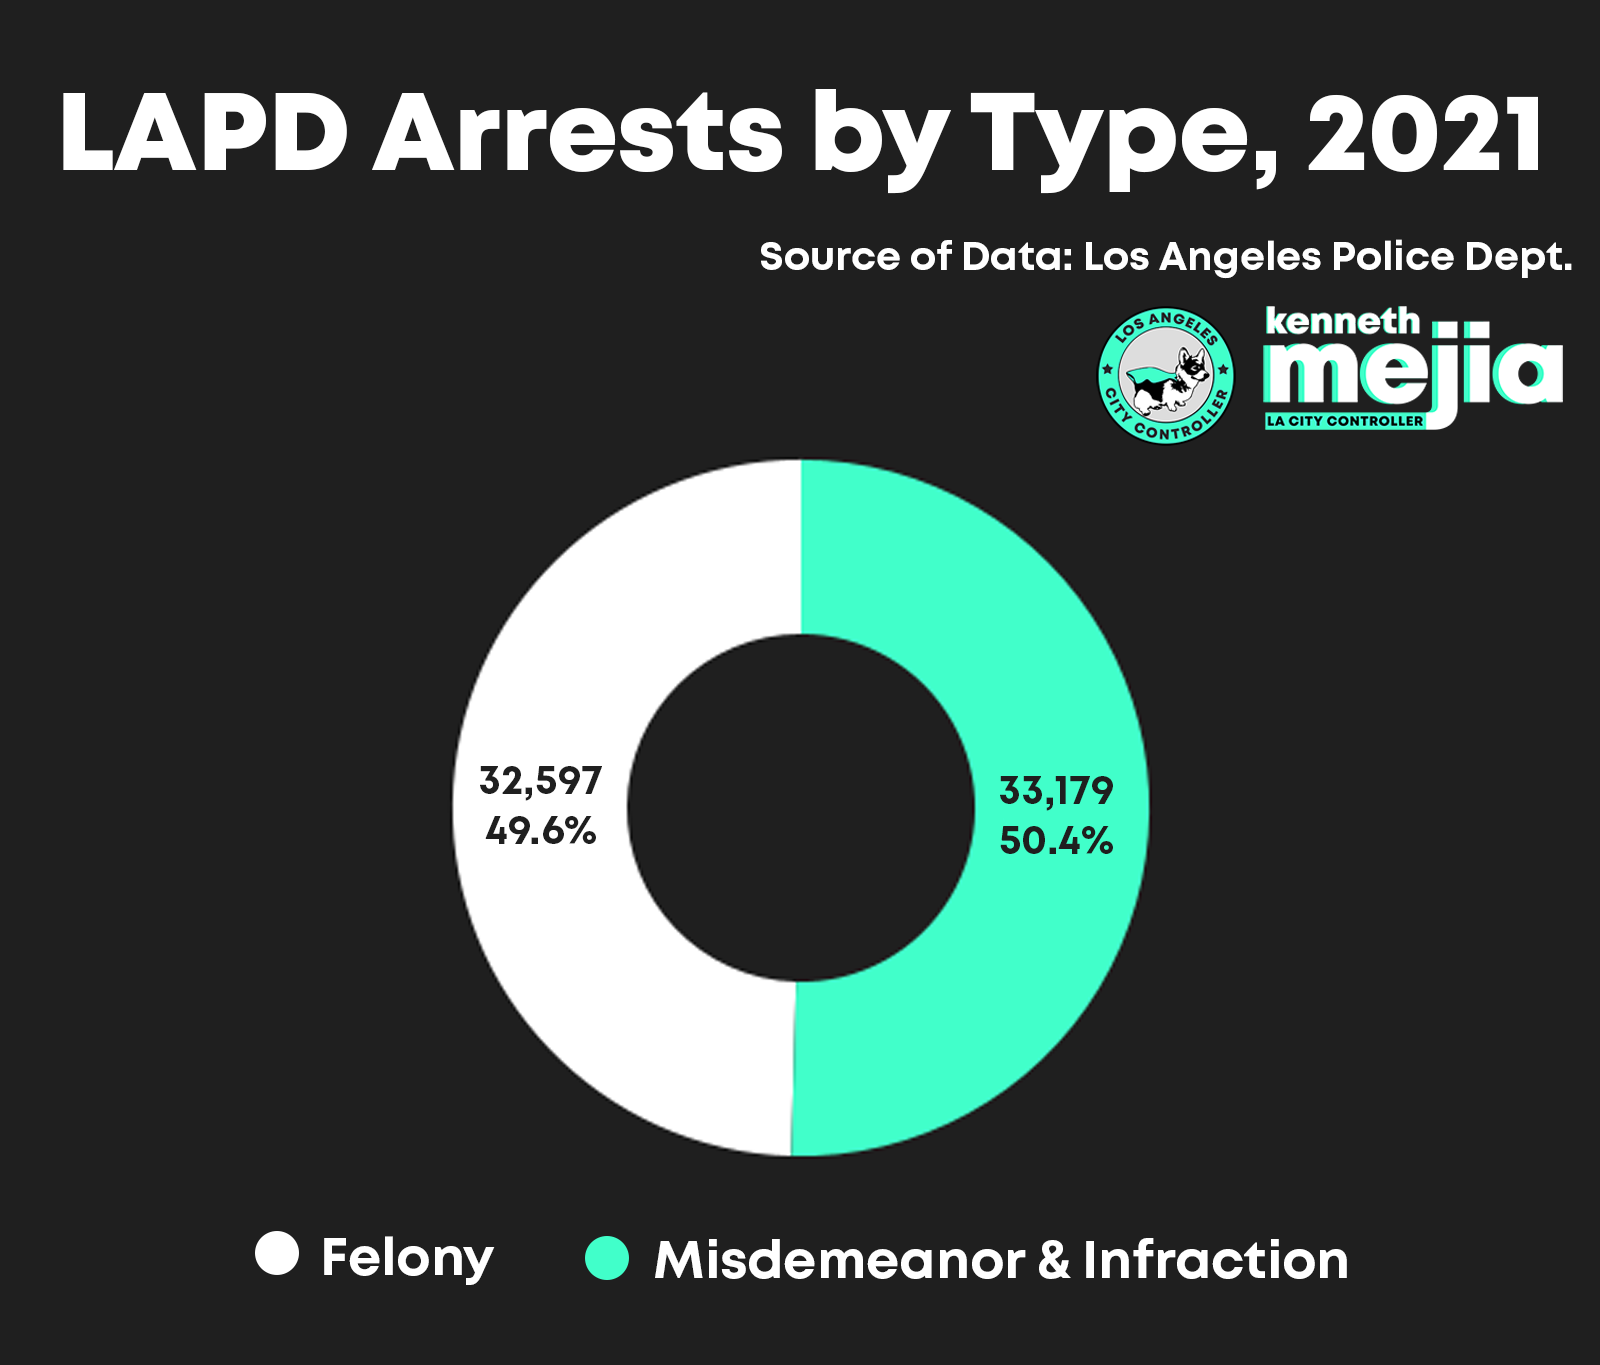
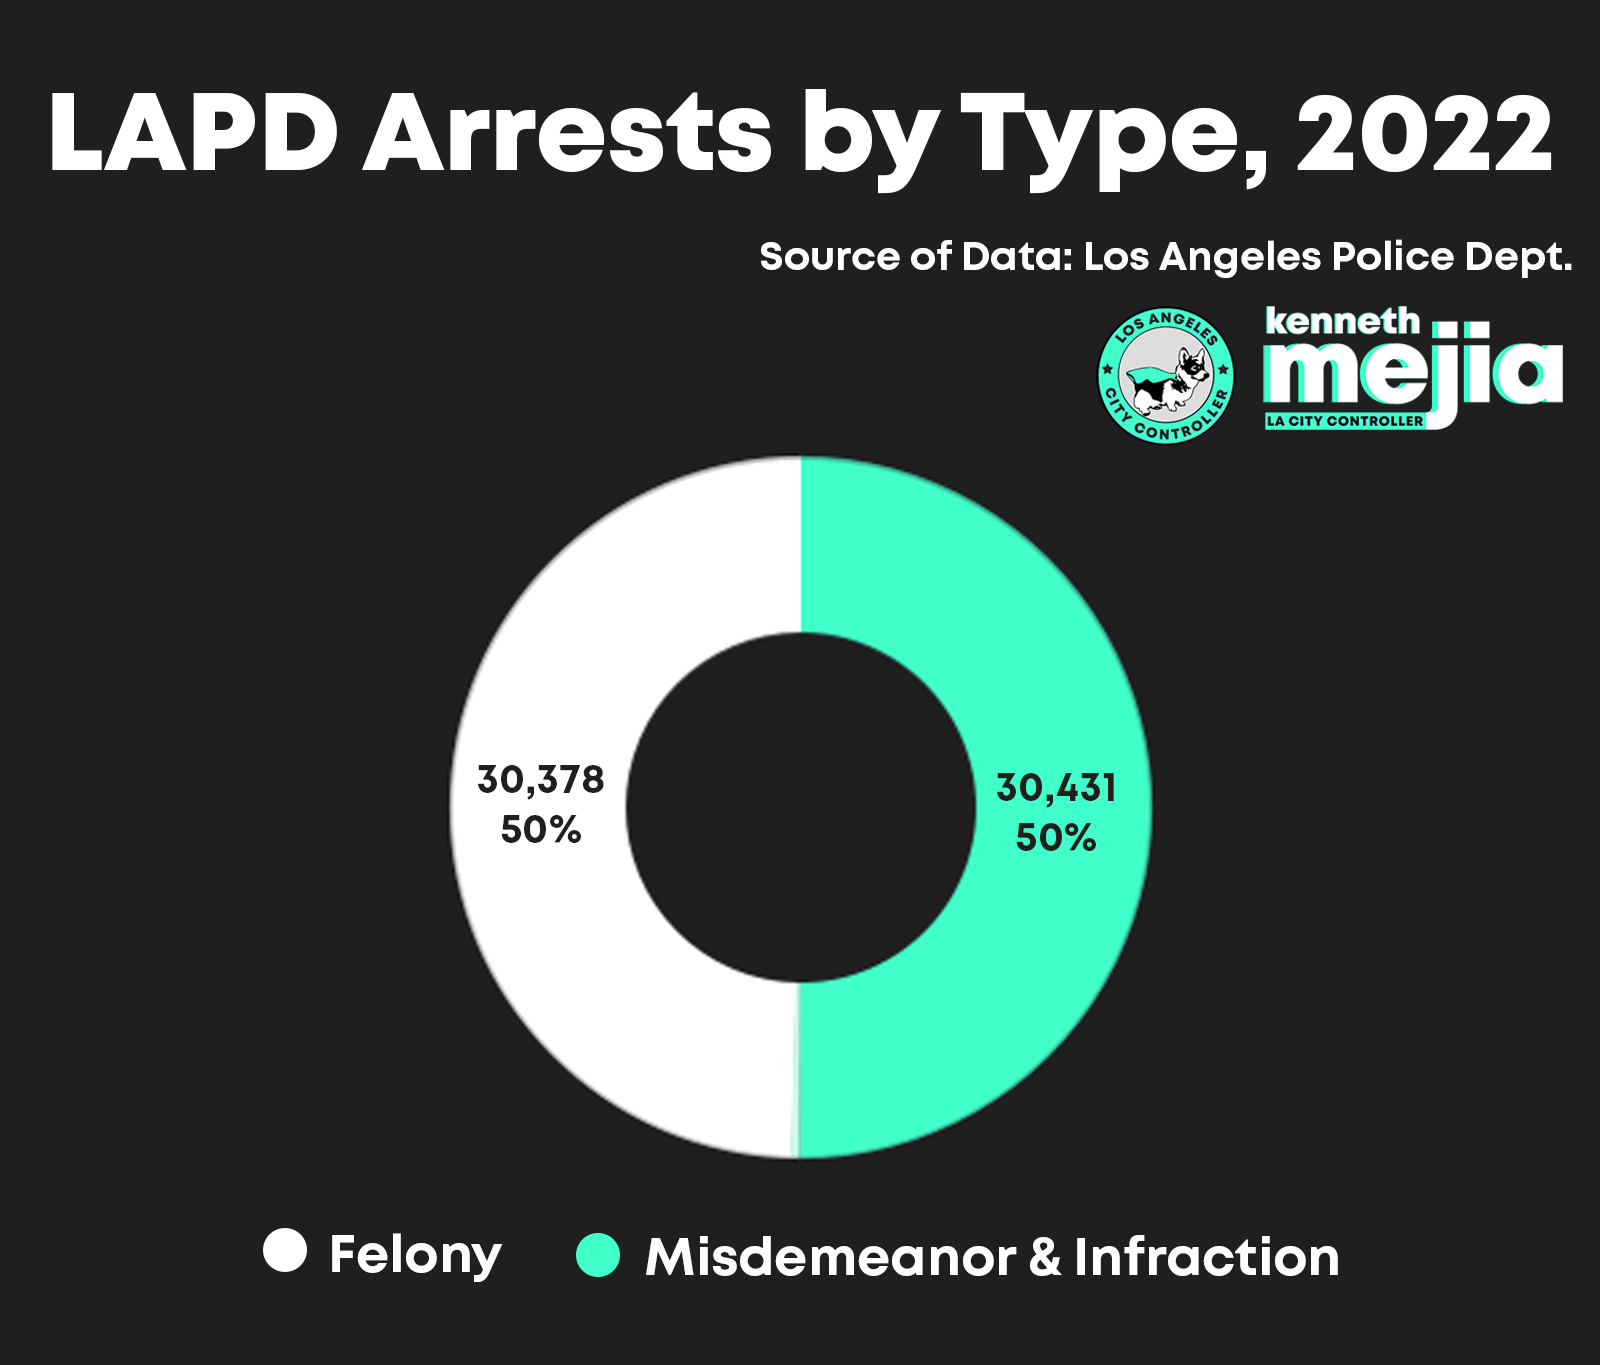
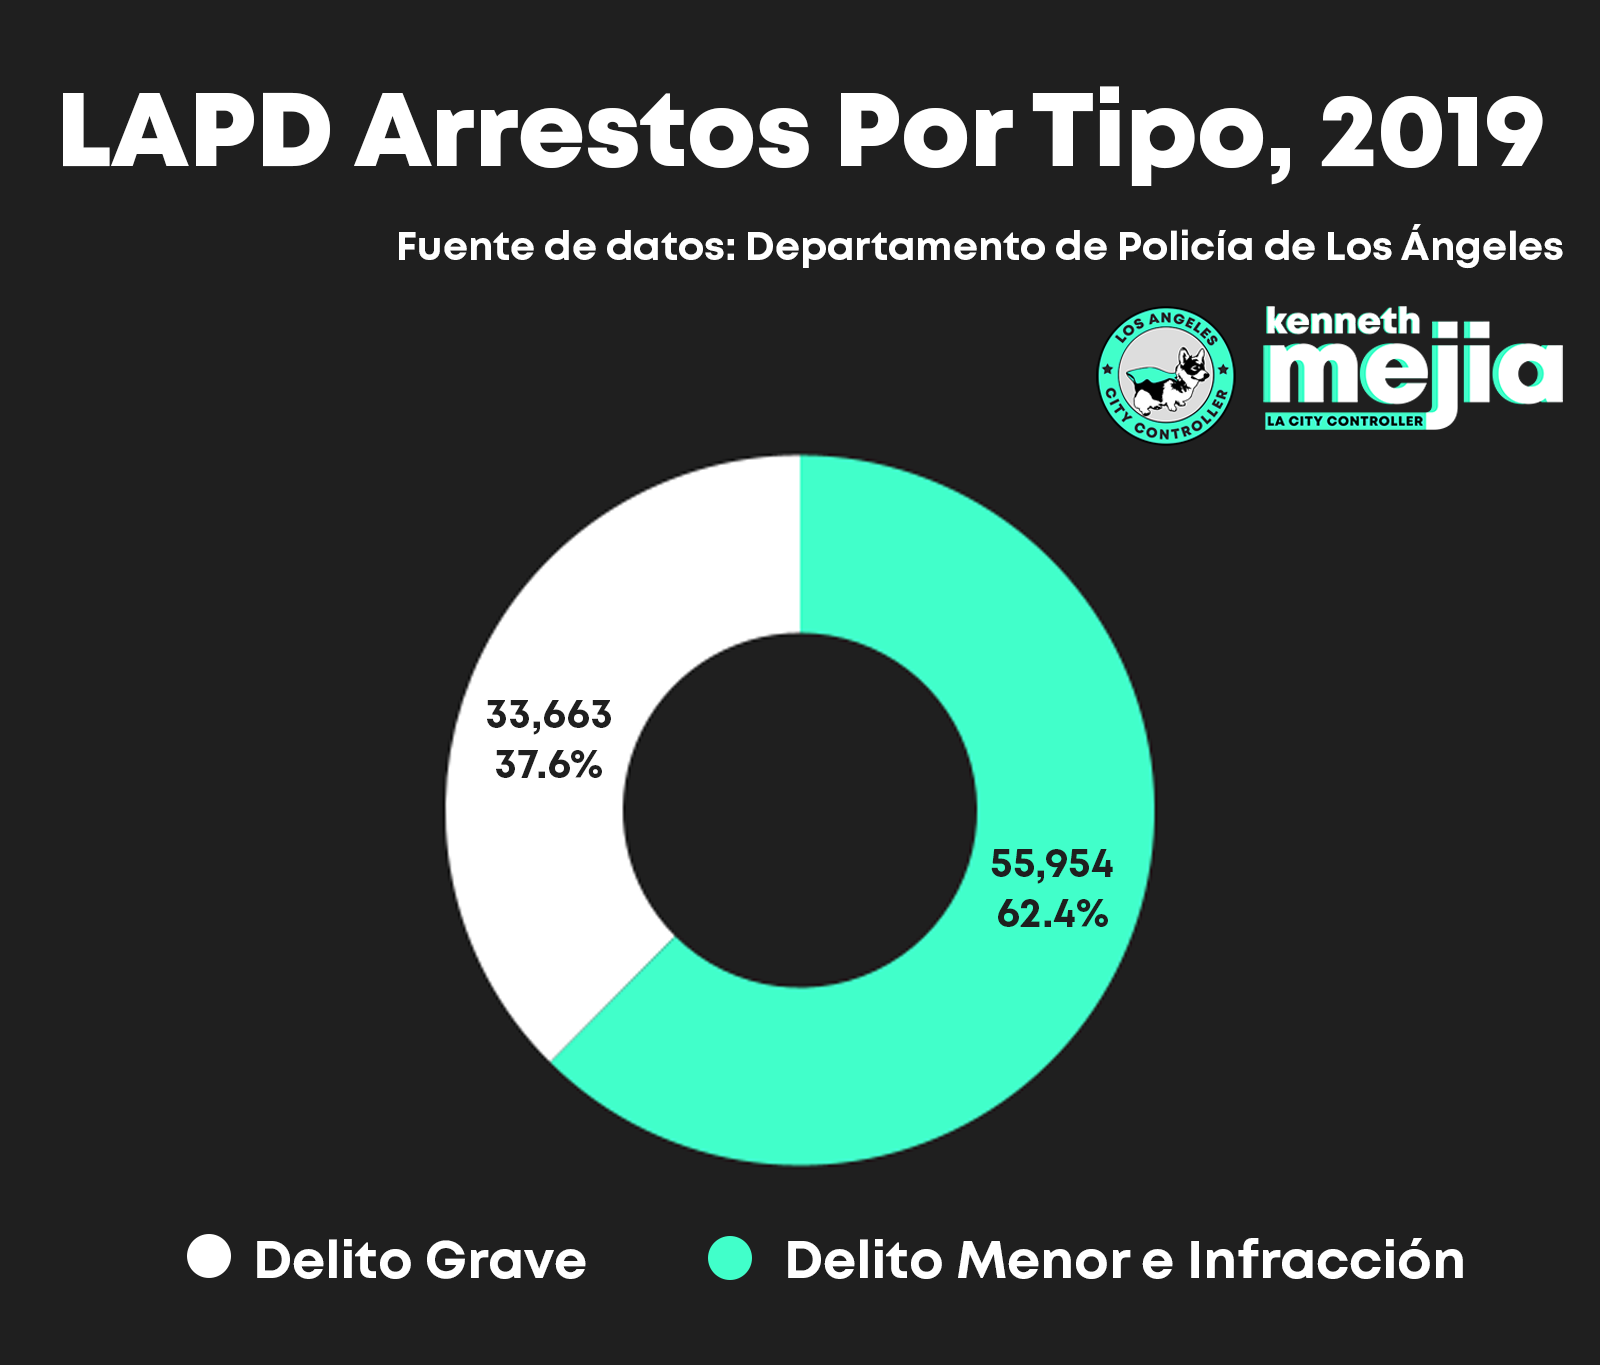
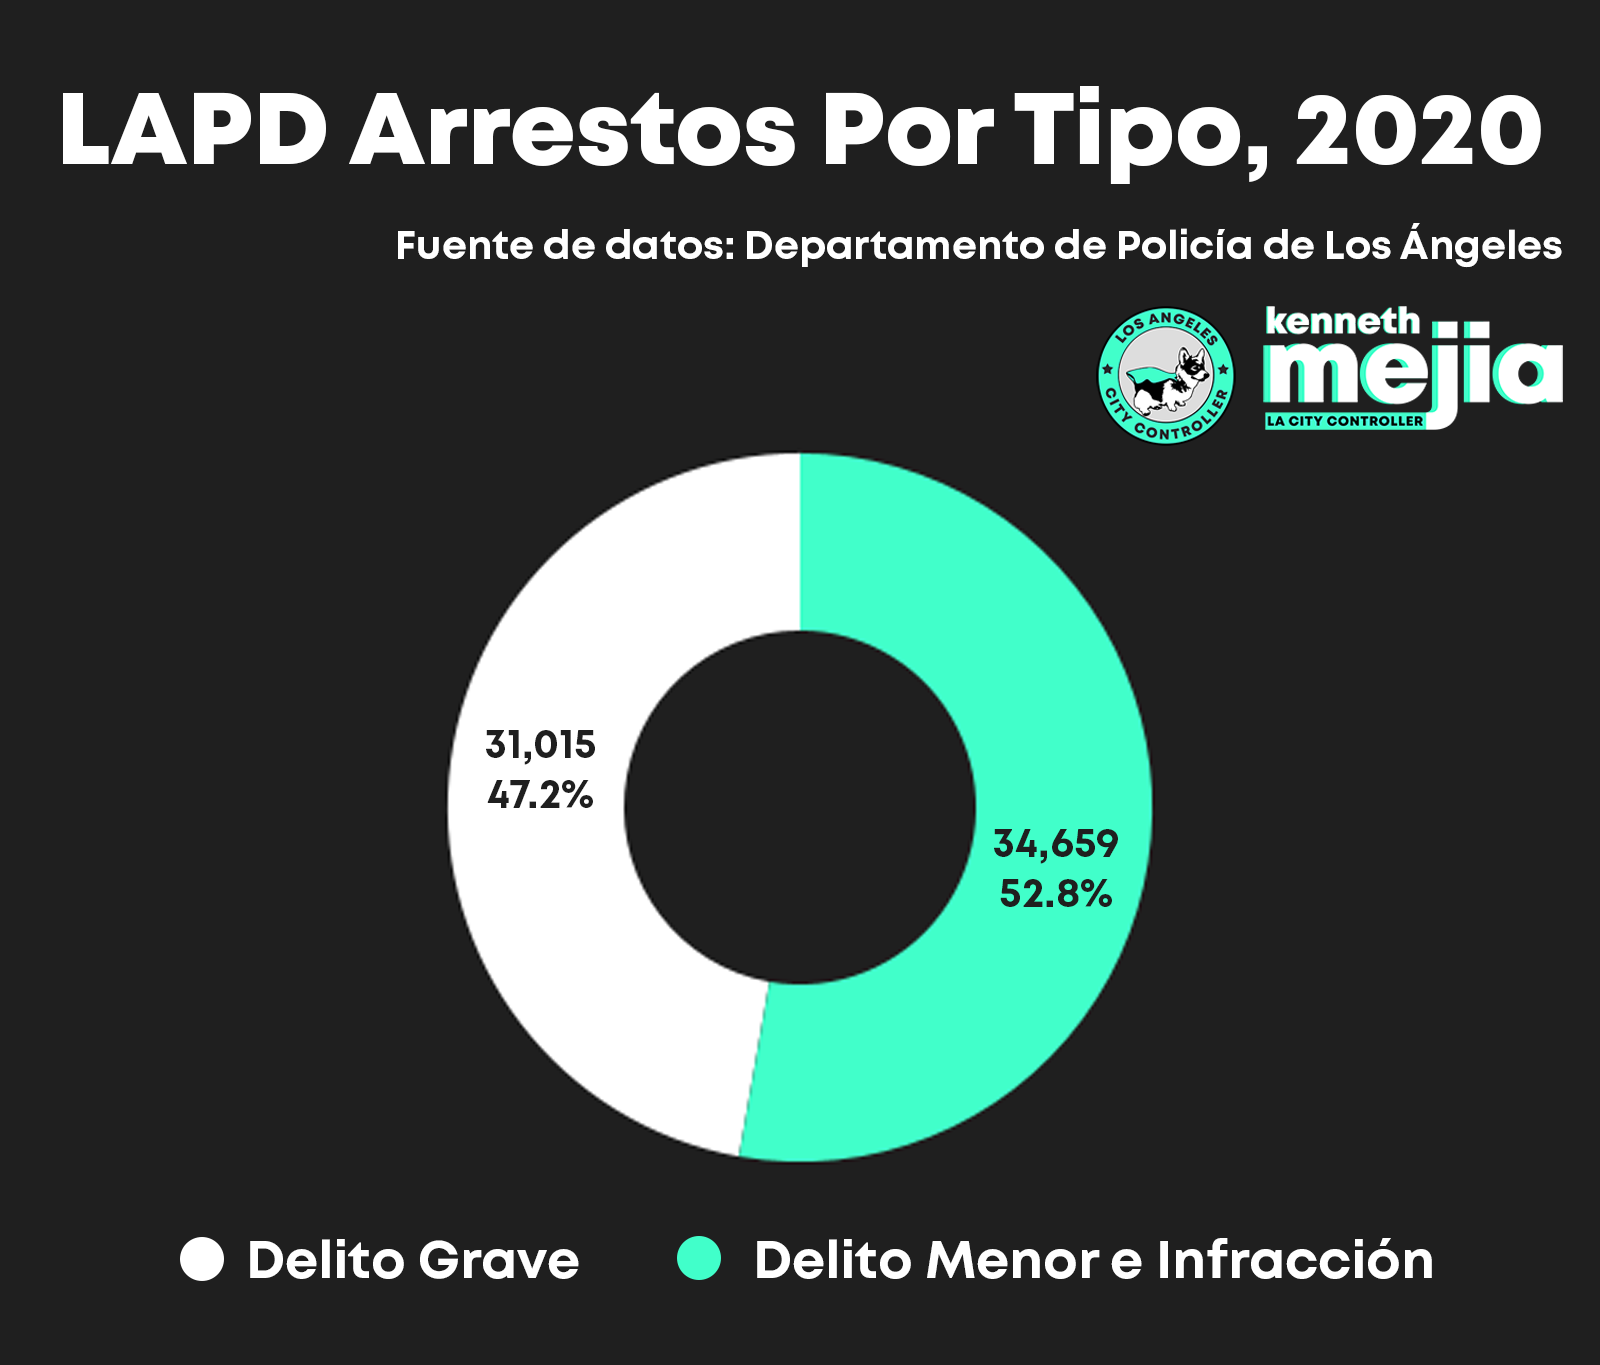
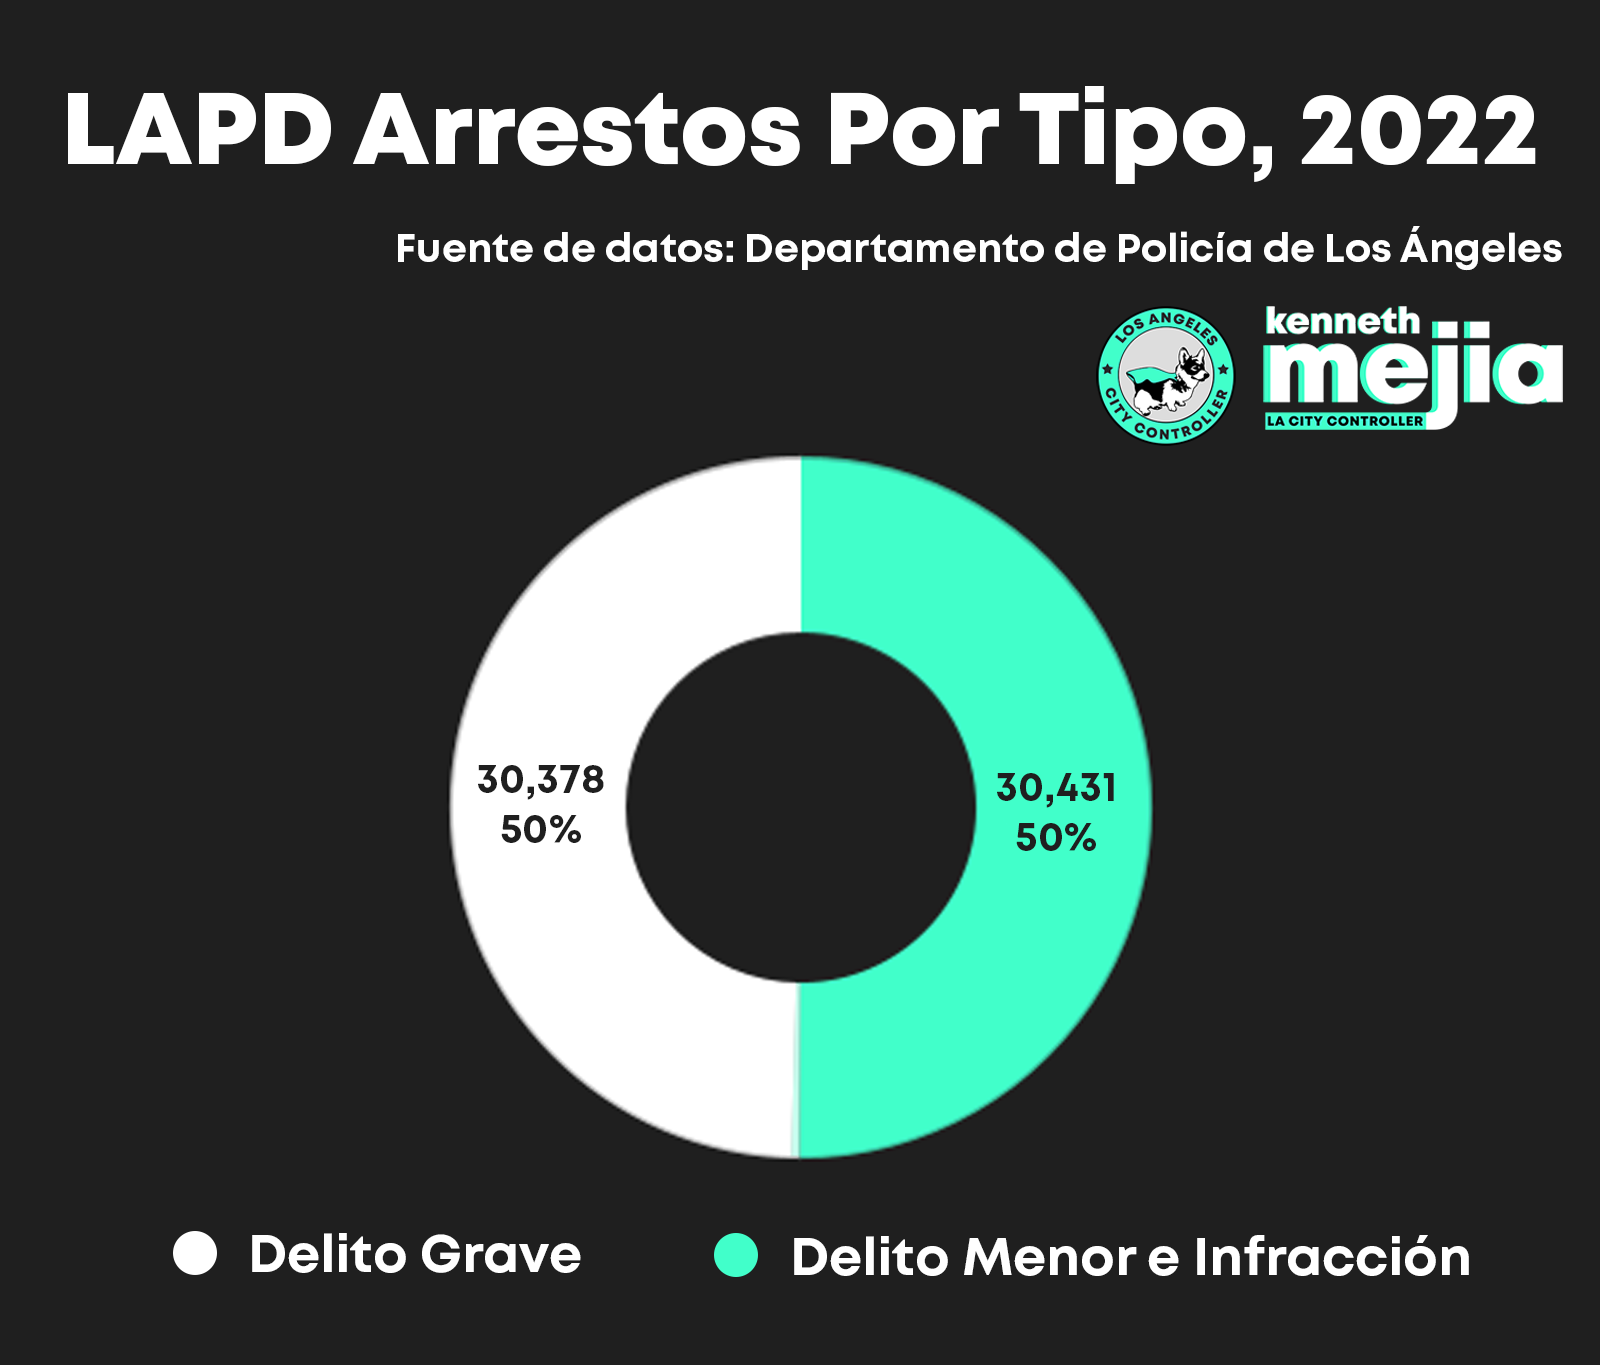
LAPD makes more arrests for misdemeanor and infraction offenses than for felonies.


  • 2019: 55,954 misdemeanor & infraction arrests vs. 33,663 felony arrests
  • 2020: 34,659 misdemeanor & infraction arrests vs. 31,015 felony arrests
  • 2021: 33,179 misdemeanor & infraction arrests vs. 32,597 felony arrests
  • 2022: 30,431 misdemeanor & infraction arrests vs. 30,378 felony arrests

Dependent Arrests


According to LAPD data, they make over 400 arrests each year in the “dependent” category.
This category includes children who are taken into custody because their parent or
guardian has been accused of abuse, neglect,
or endangerment, as well as children who are deemed to be runaways or
beyond parental control.


The data available is unclear about the nature of these interactions,
but raises questions about the frequency that children and youth are coming into contact with the LAPD.


  • 2019: 464 Dependent arrests
  • 2020: 429 Dependent arrests
  • 2021: 422 Dependent arrests
  • 2022: 545 Dependent arrests


Mapas y Análisis de Arrestos de LAPD (2019-2022)

GRÁFICO: Mapa de tiempo transcurrido mostrando tendencias de arrestos

Este mapa demuestra ubicaciones y detalles de más de 300,000 arrestos que el Departamento de Policía de Los Ángeles hizo entre 2019 y 2022. Usuarios pueden navegar el mapa y filtrar por raza, Distrito del Consejo, División de LAPD, y tipo de arrestos.

La información fue obtenida del Departamento de Policía de Los Ángeles, pero marca la primera vez que la información ha sido accesible y cartografiada para el público sin limitaciones.


Los arrestos son basados en denuncias de actos criminales que pueden o no haber ocurrido.


Abrir el Mapa

Resumen y Análisis


Arrestos por Raza

A bar chart of LAPD Arrests by Race, 2019-2022. The tallest bar is Hispanic/Latino, at 51%. Next is Black, at 27%, then White at 16%, then Other at 5%. Total arrests for each of the following 4 race categories are not more than 0%: Asian, Pacific Islander, Unknown, and American Indian/Alaskan Native. The Source of Data is LAPD.A bar chart of Los Angeles Population by Race.  Hispanic/Latino is 48%.  Black is 8%. White is 29%. Other is 0%.  Asian is 12%, Pacific Islander is 0%, 2+ races is 3%, and American Indian/Alaskan Native is 0%. Source of Data is American Community Survey, 2021 5-Year Estimate.

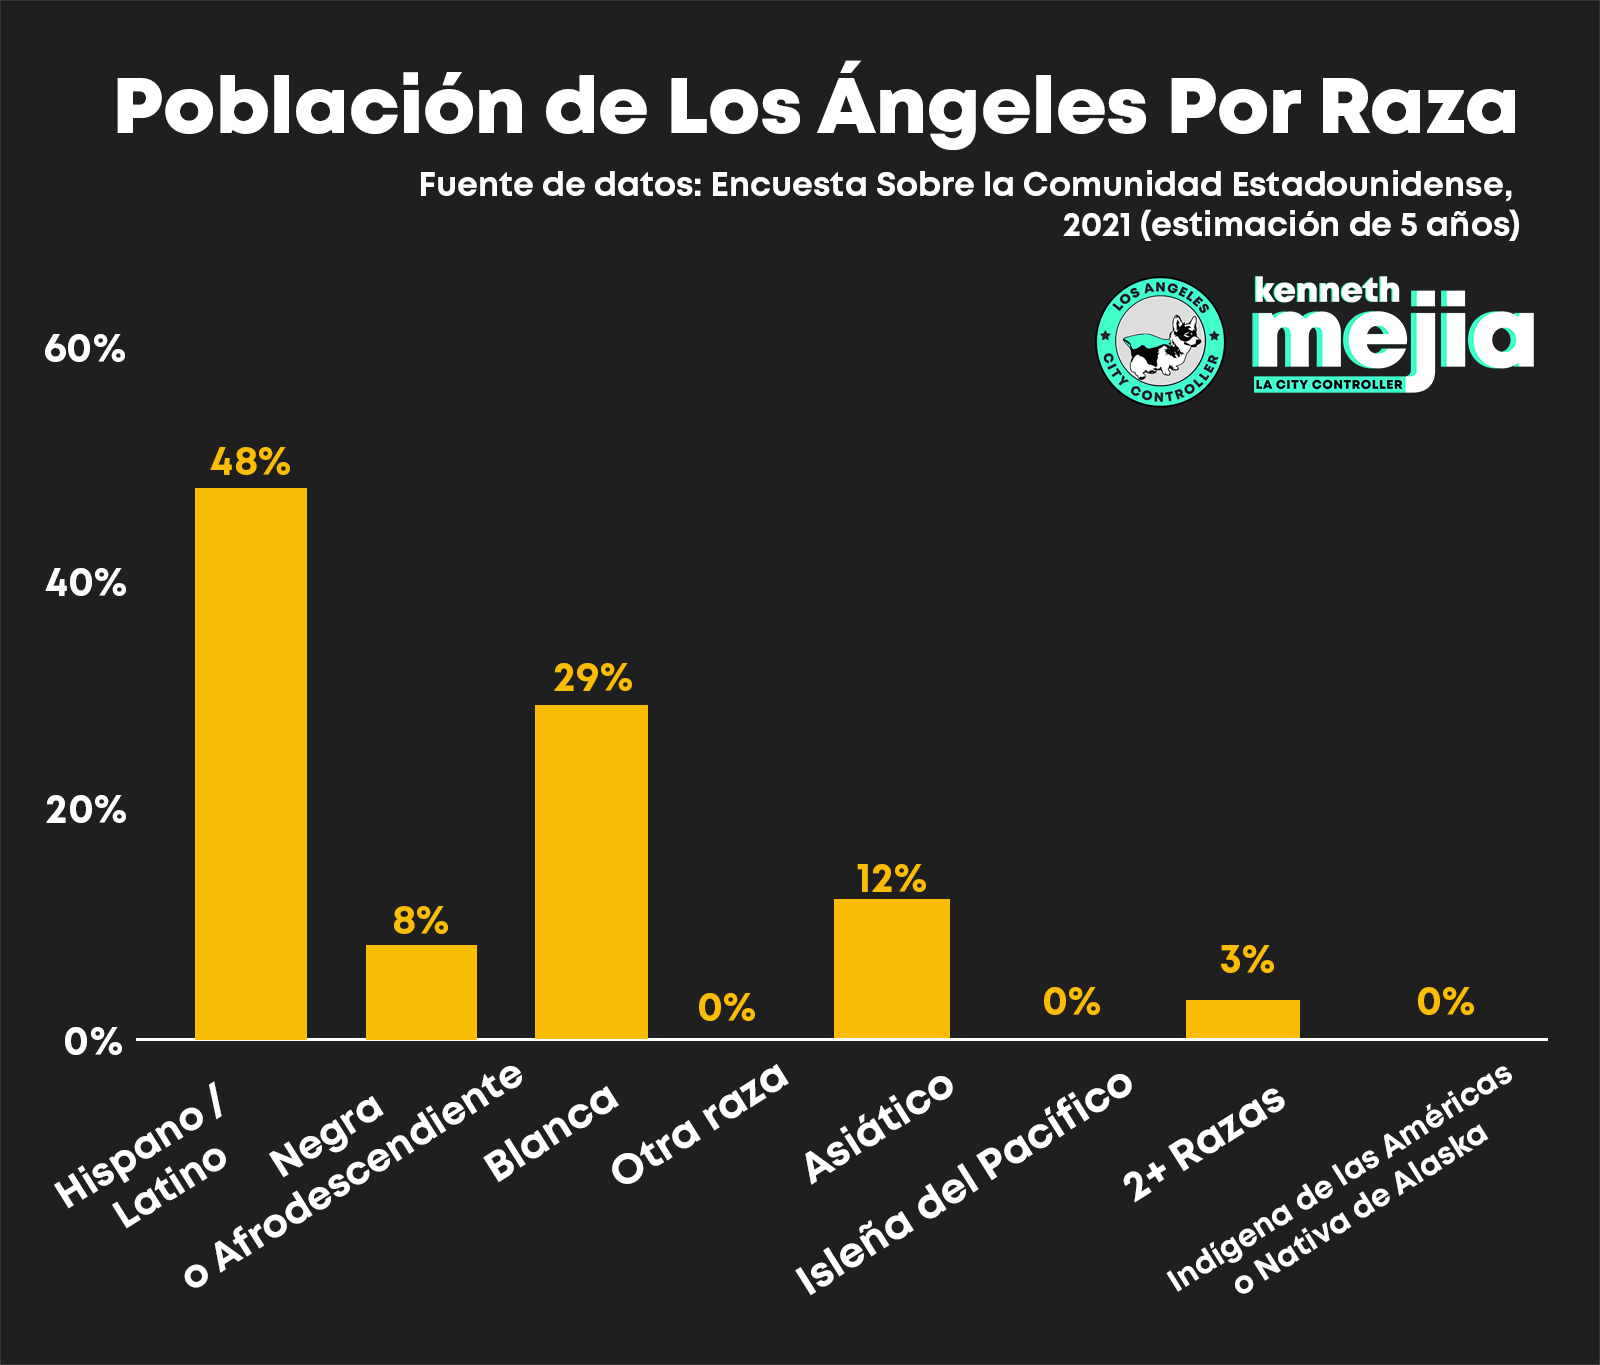
Como el mapa refleja, gente morena y negra o afrodescendiente son arrestados en una
tasa desproporcionada, componiendo un promedio de 78.26% de todos
los arrestos en los últimos cuatro años (2019-2022),
a pesar de ser solo 56% de la población de la ciudad de Los Ángeles, segun los datos del Censo de 2020.


  • Gente morena y negra o afrodescendiente = 78.26% arrestos de 2019-2022
  • Gente morena y negra o afrodescendiente = 56% de la población de la ciudad de Los Ángeles (según datos del Censo de 2020)
A bar chart of LAPD Arrests by Council District, 2019. There are 15 Council Districts. Council District 14 has a much higher number of arrests than any other district, with around 14,000 arrests. There are several other Council Districts with around 7,000 to 9,000 arrests (CDs 1, 6, 8, 9, 13), The rest of the Council Districts have fewer than around 5,000 to 6,000 arrests. CDs 5 and 12 in particular have the fewest number of arrests, at around 2,500 arrests each. Source of data is LAPD.A bar chart of LAPD Arrests by Council District, 2020. There are fewer arrests overall compared to 2019. There are 15 Council Districts. Council District 14 has the highest number of arrests, at around 7,500 arrests,  but is also fairly close in number of arrests to districts 8 and 9, which are around 6,000 arrests.  CDs 1, 6, 10, 11, and 13 each have around 5,000 arrests. The rest of the Council Districts have much fewer than 5,000  arrests. CDs 5 and 12 have the fewest number of arrests, at under 2,500 arrests each. Source of data is LAPD.
A bar chart of LAPD Arrests by Council District, 2021. There are still fewer arrests overall compared to 2019. There are 15 Council Districts. Council Districts  8 and 14 have the highest number of arrests, at around 6,000  arrests,  and are also fairly close in number of arrests to districts 9, and 11 which are also close to 6,000 arrests.  CDs 1, 6, and 13 each have around 5,000 arrests. The rest of the Council Districts havemuch fewer than 5,000  arrests. CDs 5 and 12 again have the fewest number of arrests, at under 2,500 arrests each. Source of data is LAPD.A bar chart of LAPD Arrests by Council District, 2022. There are still fewer arrests overall compared to 2019. There are 15 Council Districts. Council Districts 14, 8, and 1 have the highest number of arrests, at around 5,000 to 6,000  arrests,  and are also fairly close in number of arrests to districts 6, 9,  11, and 13 which are also close to 5,000 arrests. The rest of the Council Districts havemuch fewer than 5,000  arrests. CDs 4 and 5 have the fewest number of arrests, at under 2,500 arrests each. Source of data is LAPD.

Arrestos por Distrito del Consejo

A bar chart of LAPD Arrests by Council District, 2019. There are 15 Council Districts. Council District 14 has a much higher number of arrests than any other district, with around 14,000 arrests. There are several other Council Districts with around 7,000 to 9,000 arrests (CDs 1, 6, 8, 9, 13), The rest of the Council Districts have fewer than around 5,000 to 6,000 arrests. CDs 5 and 12 in particular have the fewest number of arrests, at around 2,500 arrests each. Source of data is LAPD.A bar chart of LAPD Arrests by Council District, 2020. There are fewer arrests overall compared to 2019. There are 15 Council Districts. Council District 14 has the highest number of arrests, at around 7,500 arrests,  but is also fairly close in number of arrests to districts 8 and 9, which are around 6,000 arrests.  CDs 1, 6, 10, 11, and 13 each have around 5,000 arrests. The rest of the Council Districts have much fewer than 5,000  arrests. CDs 5 and 12 have the fewest number of arrests, at under 2,500 arrests each. Source of data is LAPD.
A bar chart of LAPD Arrests by Council District, 2021. There are still fewer arrests overall compared to 2019. There are 15 Council Districts. Council Districts  8 and 14 have the highest number of arrests, at around 6,000  arrests,  and are also fairly close in number of arrests to districts 9, and 11 which are also close to 6,000 arrests.  CDs 1, 6, and 13 each have around 5,000 arrests. The rest of the Council Districts havemuch fewer than 5,000  arrests. CDs 5 and 12 again have the fewest number of arrests, at under 2,500 arrests each. Source of data is LAPD.A bar chart of LAPD Arrests by Council District, 2022. There are still fewer arrests overall compared to 2019. There are 15 Council Districts. Council Districts 14, 8, and 1 have the highest number of arrests, at around 5,000 to 6,000  arrests,  and are also fairly close in number of arrests to districts 6, 9,  11, and 13 which are also close to 5,000 arrests. The rest of the Council Districts havemuch fewer than 5,000  arrests. CDs 4 and 5 have the fewest number of arrests, at under 2,500 arrests each. Source of data is LAPD.

Casi cada año, el Distrito del Consejo 14 lidera todos los otros distritos en número de arrestos totales.
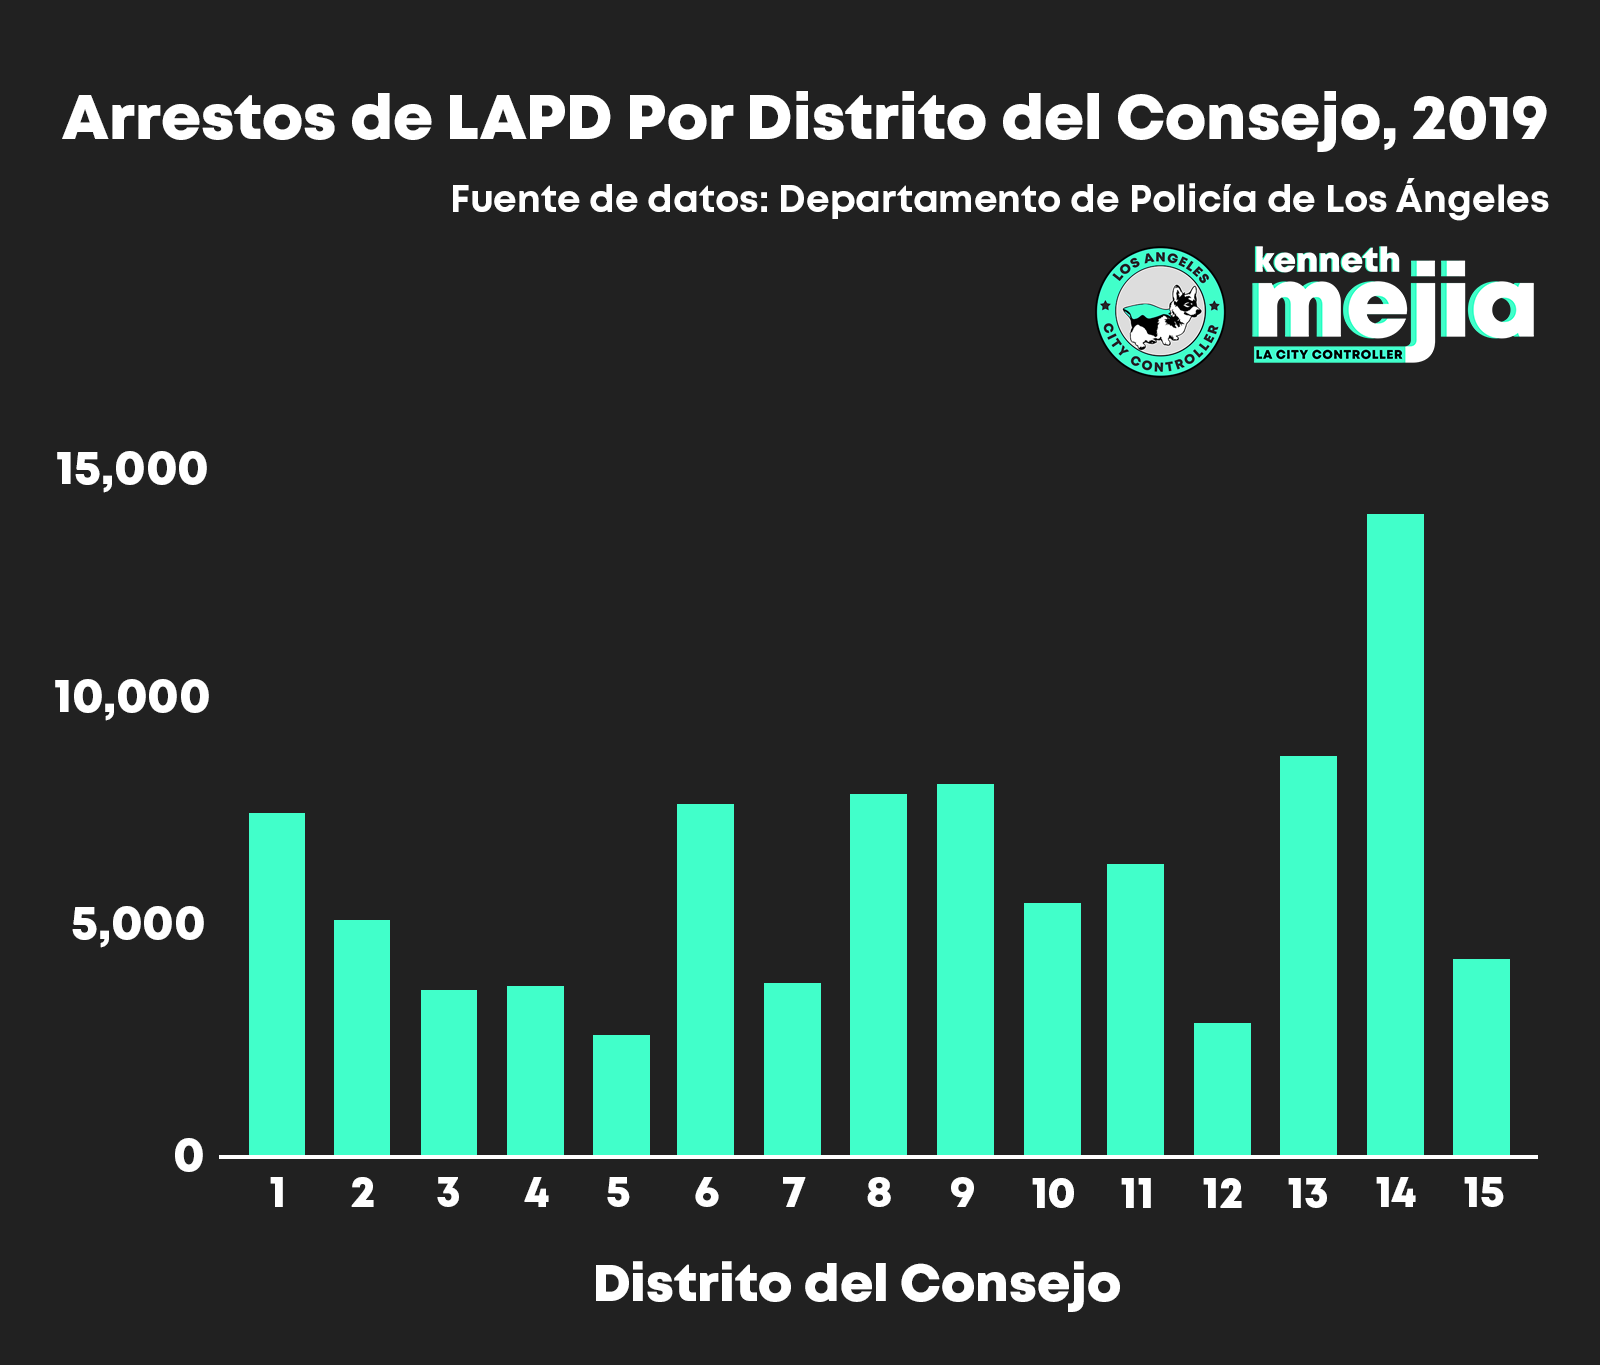
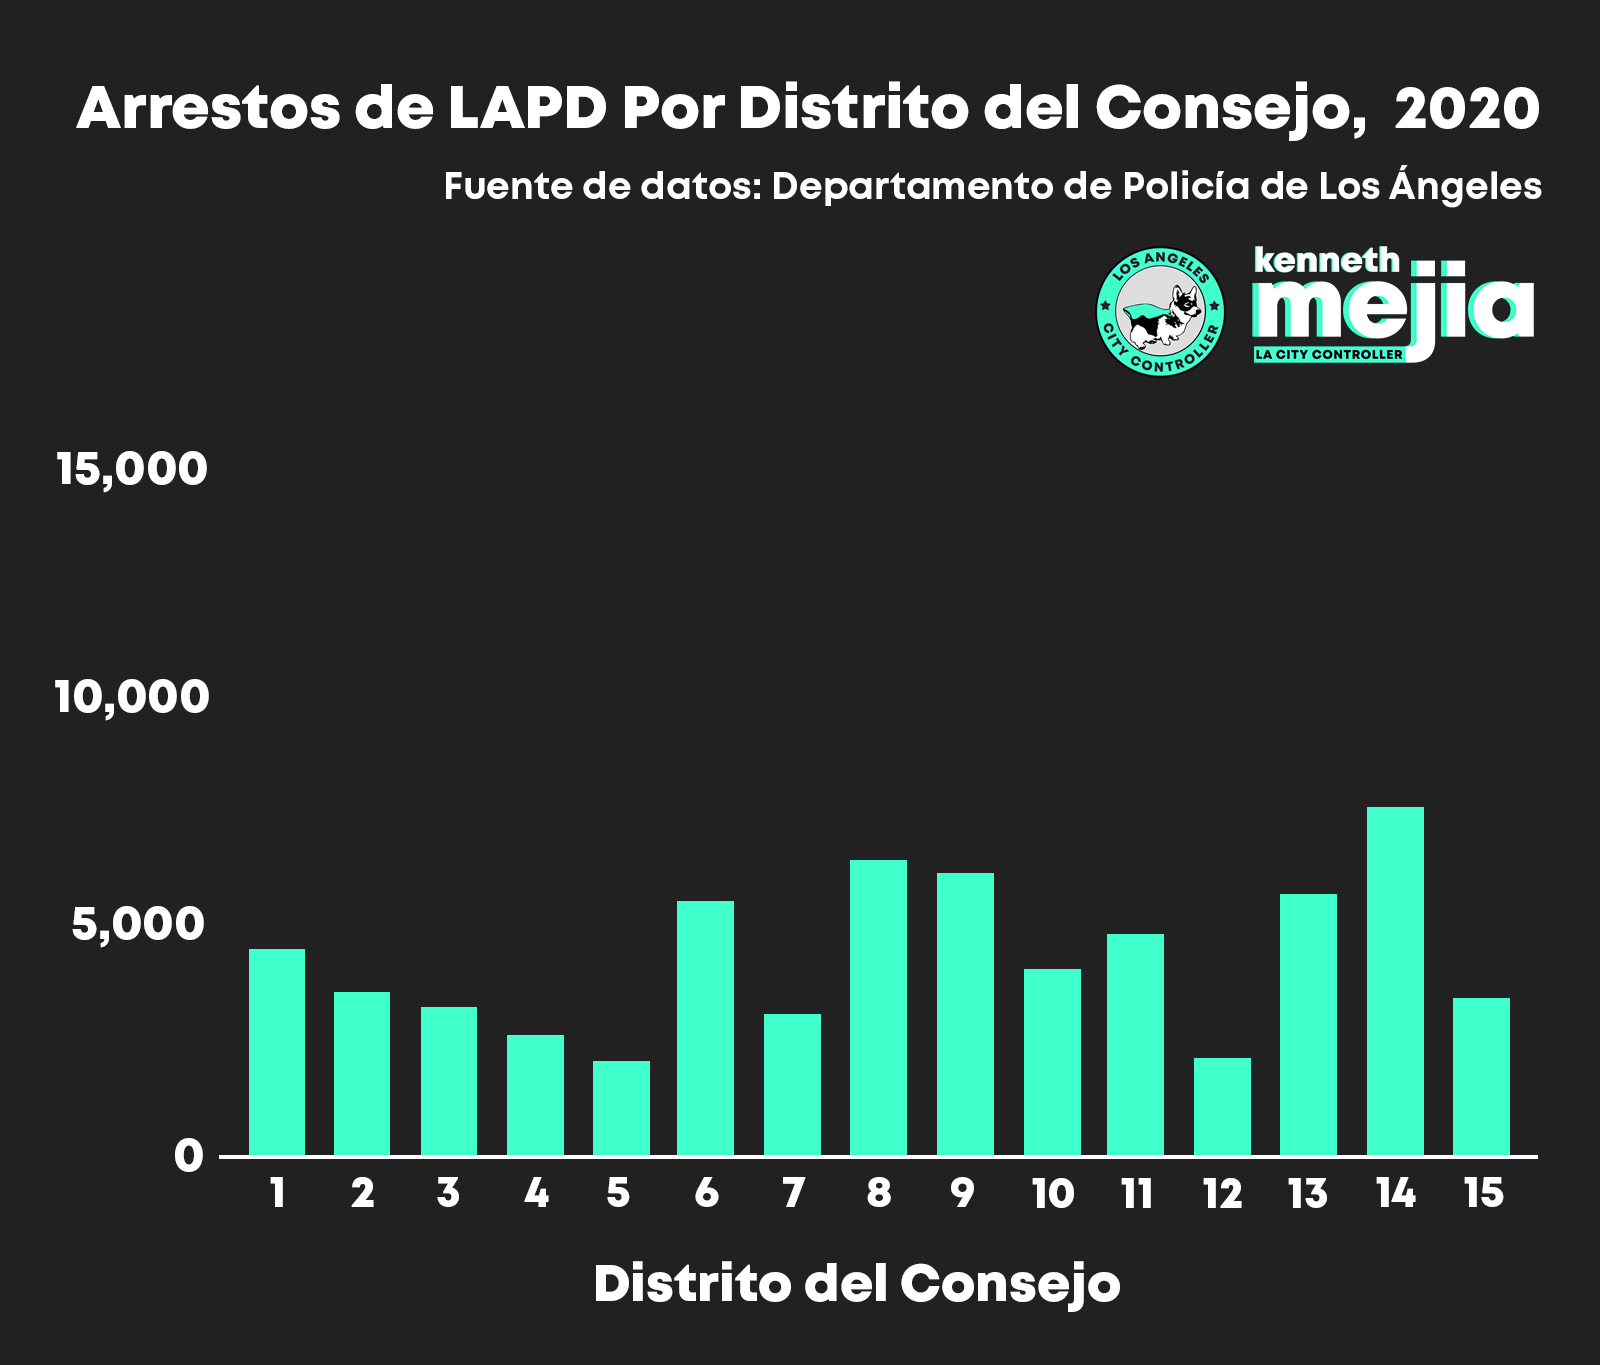
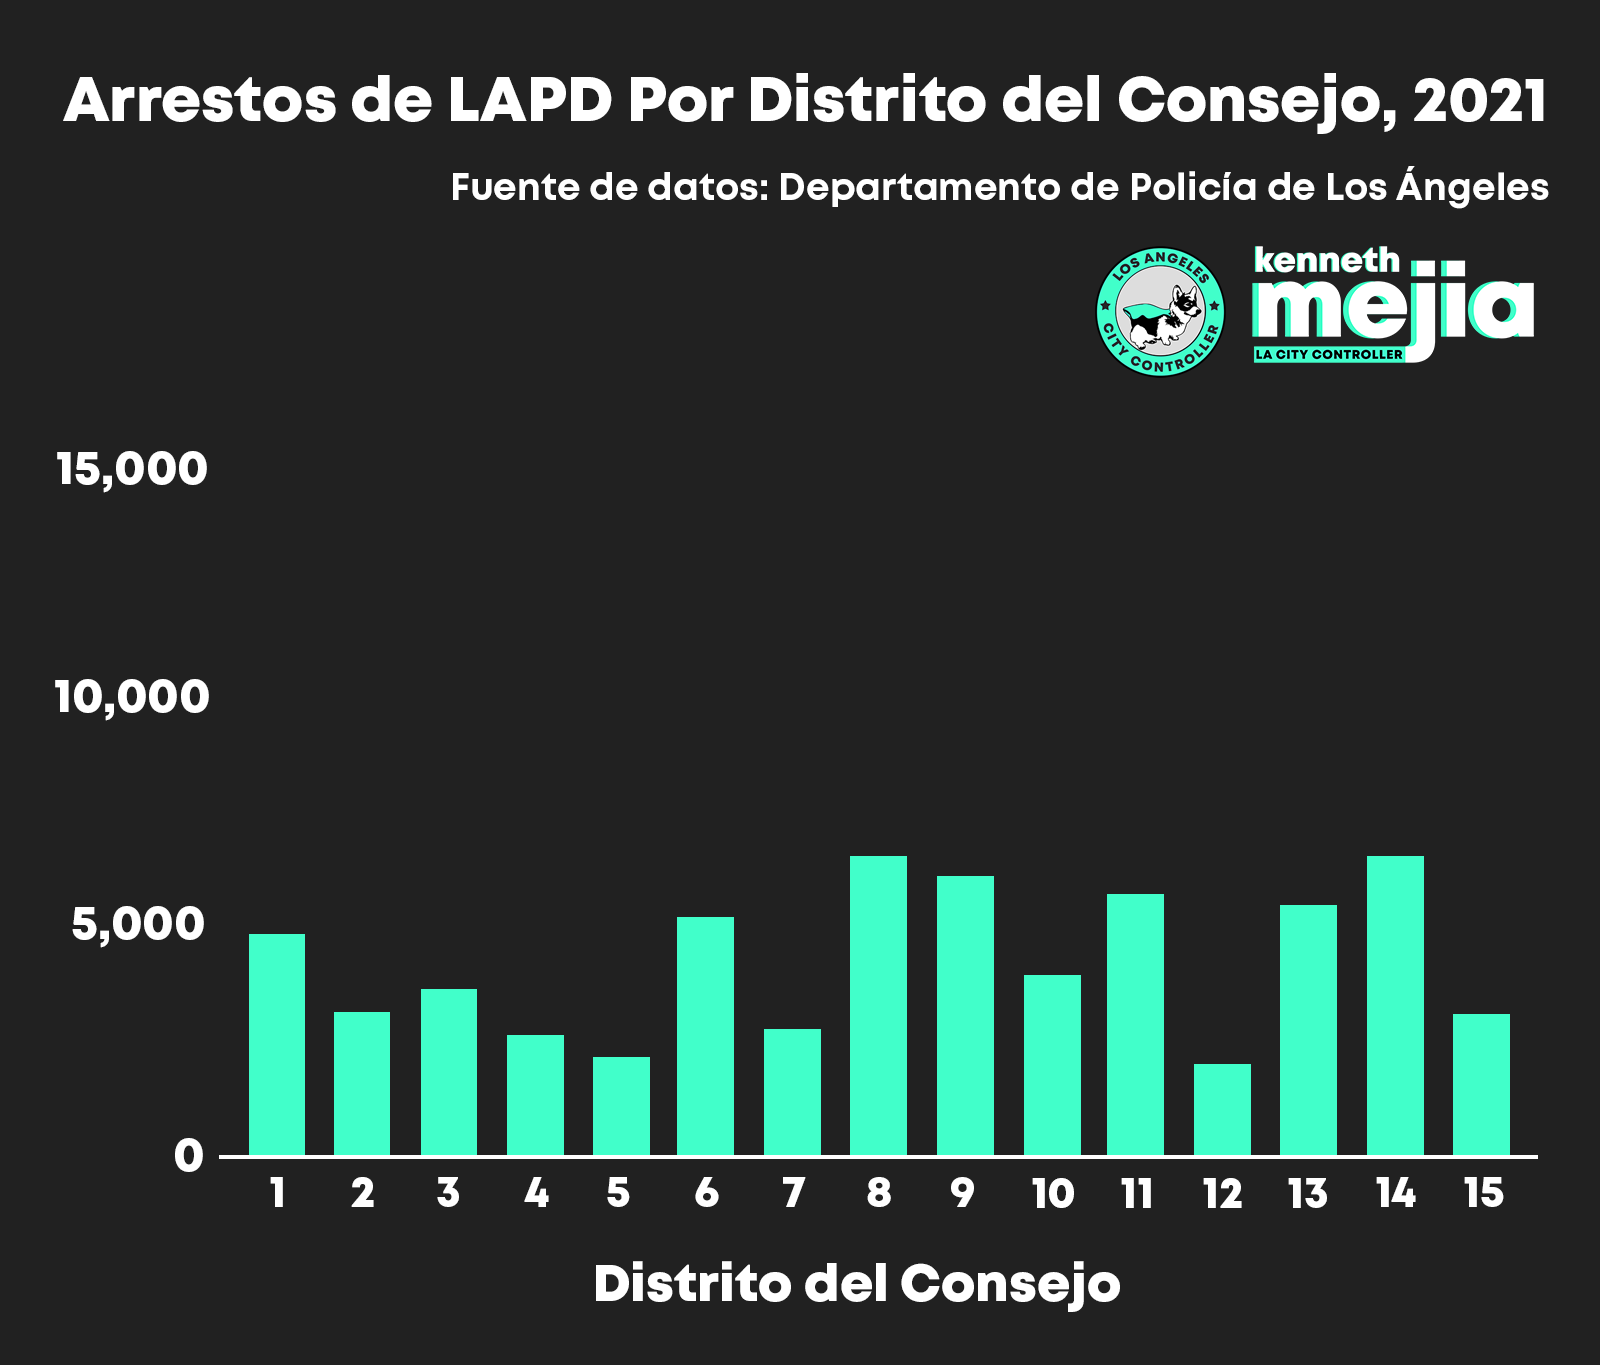
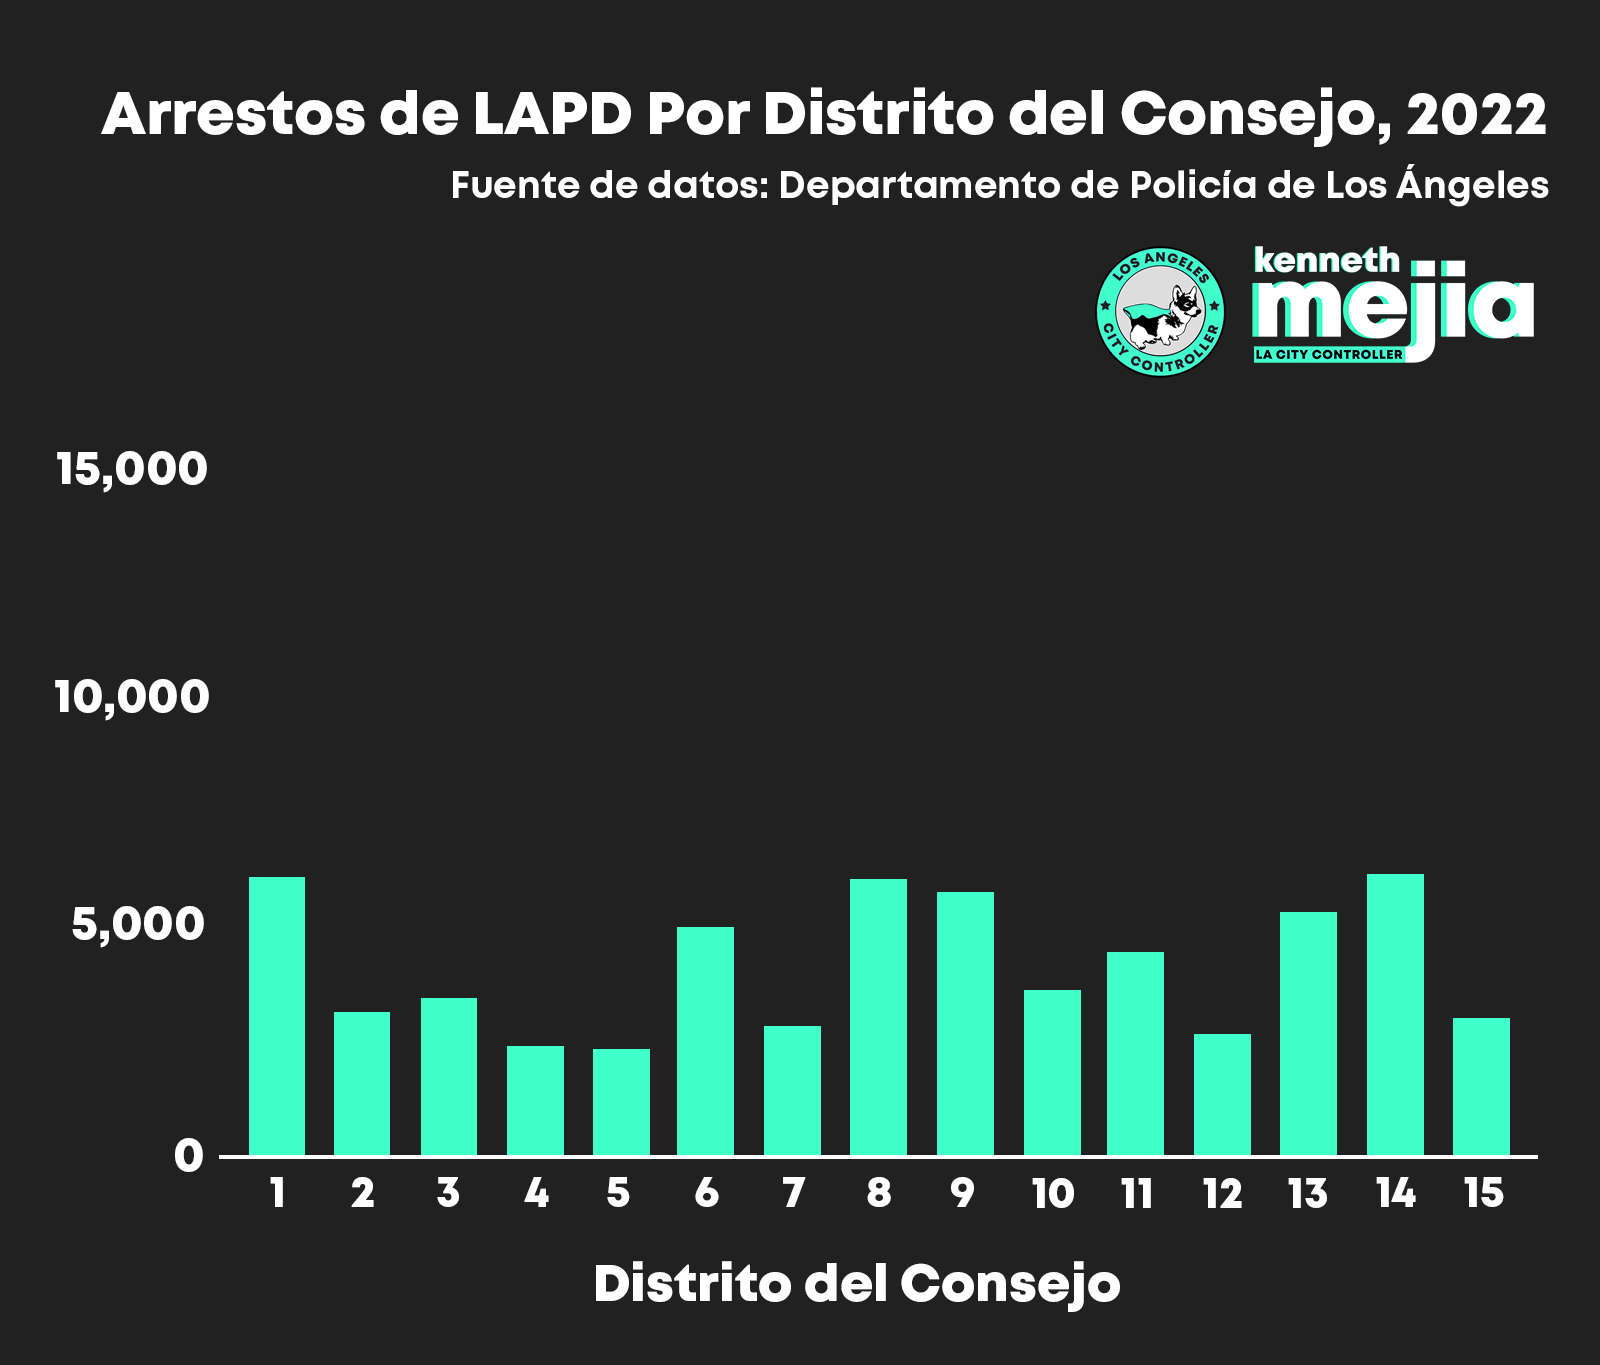
En el 2021, llegó en segundo lugar, después del Distrito del Consejo 8, con una diferencia de solo 3 arrestos.


Tipo de Arresto

A bar chart of LAPD Arrests by Council District, 2019. There are 15 Council Districts. Council District 14 has a much higher number of arrests than any other district, with around 14,000 arrests. There are several other Council Districts with around 7,000 to 9,000 arrests (CDs 1, 6, 8, 9, 13), The rest of the Council Districts have fewer than around 5,000 to 6,000 arrests. CDs 5 and 12 in particular have the fewest number of arrests, at around 2,500 arrests each. Source of data is LAPD.A bar chart of LAPD Arrests by Council District, 2020. There are fewer arrests overall compared to 2019. There are 15 Council Districts. Council District 14 has the highest number of arrests, at around 7,500 arrests,  but is also fairly close in number of arrests to districts 8 and 9, which are around 6,000 arrests.  CDs 1, 6, 10, 11, and 13 each have around 5,000 arrests. The rest of the Council Districts have much fewer than 5,000  arrests. CDs 5 and 12 have the fewest number of arrests, at under 2,500 arrests each. Source of data is LAPD.
A bar chart of LAPD Arrests by Council District, 2021. There are still fewer arrests overall compared to 2019. There are 15 Council Districts. Council Districts  8 and 14 have the highest number of arrests, at around 6,000  arrests,  and are also fairly close in number of arrests to districts 9, and 11 which are also close to 6,000 arrests.  CDs 1, 6, and 13 each have around 5,000 arrests. The rest of the Council Districts havemuch fewer than 5,000  arrests. CDs 5 and 12 again have the fewest number of arrests, at under 2,500 arrests each. Source of data is LAPD.A bar chart of LAPD Arrests by Council District, 2022. There are still fewer arrests overall compared to 2019. There are 15 Council Districts. Council Districts 14, 8, and 1 have the highest number of arrests, at around 5,000 to 6,000  arrests,  and are also fairly close in number of arrests to districts 6, 9,  11, and 13 which are also close to 5,000 arrests. The rest of the Council Districts havemuch fewer than 5,000  arrests. CDs 4 and 5 have the fewest number of arrests, at under 2,500 arrests each. Source of data is LAPD.

Los tipos de arresto de LAPD se dividen en cinco categorías identificadas por LAPD:
(1) delito grave, (2) delito menor, (3) infracciones, (4) dependiente y (5) otros.

Según la ley de California, un delito grave es un delito que puede ser castigado con la muerte, con encarcelamiento en una prisión estatal o por encarcelamiento en
una cárcel del condado bajo [ciertas disposiciones]. Cualquier otro delito y ofensa pública es un delito menos grave,
excepto aquellos delitos que se clasifican como infracciones. Los delitos menores y las infracciones conllevan diversos grados de consecuencias financieras y de encarcelamiento.


LAPD hace más arrestos por delitos menores e infracciones que por delitos graves.


  • 2019: 55,954 arrestos por delitos menores e infracciones frente a 33,663 arrestos por delitos graves
  • 2020: 34,659 arrestos por delitos menores e infracciones frente a 31,015 arrestos por delitos graves
  • 2021: 33,179 arrestos por delitos menores e infracciones frente a 32 597 arrestos por delitos graves
  • 2022: 30,431 arrestos por delitos menores e infracciones frente a 30 378 arrestos por delitos graves

Arrestos de dependientes


Según los datos de LAPD, realizan más de 400 arrestos cada año en la categoría de “dependientes”.
Esta categoría incluye niños detenidos porque sus padres o guardián han sido acusados
​de abuso, negligencia o peligro, así como niños que se consideran fugitivos o fuera del control de los padres.


Los datos disponibles no son claros sobre la naturaleza de estas interacciones, pero plantean dudas sobre
la frecuencia con la que los niños y jóvenes entran en contacto con el Departamento de Policía de Los Ángeles.


  • 2019: 464 arrestos de dependientes
  • 2020: 429 arrestos de dependientes
  • 2021: 422 arrestos de dependientes
  • 2022: 545 arrestos de dependientes