Preliminary Financial Report FY19
A first look at the City’s financial performance in the fiscal year ending June 30, 2019
In May 2018, the City Council approved a budget of $9.9 billion for the fiscal year from July 1, 2018 through June 30, 2019. The Preliminary Financial Report provides data and analysis of the City’s revenues and expenditures for that fiscal year. It details where the City’s budgeted funds came from, how they were spent and more.
Why Is This Report Important?
One of the City Controller’s primary responsibilities is analyzing and reporting on the City’s finances. The reports produced by the Controller inform City officials and the public about the City’s financial activities and financial status. They also aim to initiate meaningful reflection and debate about the City’s fiscal management.
The Preliminary Financial Report, made available each October after the City’s books are closed, is the first of these reports. It provides information on how the City spent its funds over the past fiscal year, featuring data and analysis of the City’s revenues and expenditures, the Reserve Fund, the Budget Stabilization Fund, and the City’s bonded indebtedness.
More complete and detailed information, presented in accordance with Generally Accepted Accounting Practices will be published in the Comprehensive Annual Financial Report in January 2020. Below is an interactive version of the Preliminary Financial Report followed by the full report. You can also download a pdf of the full report on the right side of this page.
Data Visualizations
Revenues
During the 2018-19 fiscal year, revenue grew by 7.2% in the General Fund and 11.6% in on-budget special funds. This was led by all-time high receipts from Property Tax, Business Tax, Sales Tax, and Licenses, Permits, Fees, and Fines. Combining General Fund and on-budget special fund revenue, total revenue increased by 8.6% over 2017-18.
View this interactive data visualization to explore the relative size of the City’s revenue sources and their growth over the past 10 years.
Open the City Revenues by Source visualization (opens in a new tab)
Expenditures
Total expenditures grew at a rate of 4.5%, due in large part to salary and benefit increases. Expenditures are projected to accelerate in the next year, with newly-executed employment contracts for almost every City employee guaranteeing pay increases, as well as projected increases in health care costs and retirement contributions.
This interactive data visualization compares the expenditures of the City’s different departments, as well as non-departmental expenditures, over the past 10 years. View total expenditures, salaries, other expenditures, descriptions of each item, and the change of each item over time.
Open the City Expenditures visualization (opens in a new tab)
Reserve Fund and Budget Stabilization Fund
It is crucial that the City build up reserve funds during years of strong growth in order to prepare for future downturns. In the last ten fiscal years, the City’s Reserve Fund rose from 3.9% in July 2009 to its 8.2% peak at the beginning of 2015-16, but has since declined to 6.2% of the 2018-19 Adopted General Fund Budget.
Reserve Fund
The Reserve Fund is established to ensure that funds are available for unanticipated expenditures and revenue shortfalls in the General Fund. The City’s Reserve Fund Policy sets a goal for the Reserve Fund of at least 5% of the General Fund budget every year.
On July 1, 2019, the Reserve Fund had a balance of $404.3 million, 6.2% of the 2019-2020 General Fund budget and $79 million above the 5% Reserve Fund Policy goal.
Budget Stabilization Fund
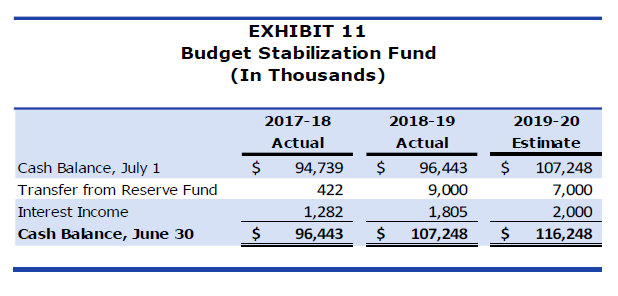
The Budget Stabilization Fund (BSF) was added to the City Charter in 2011. The purpose of the BSF is to set aside funds when revenue projections are exceeded to help smooth out years when revenue is stagnant or is in decline. In fiscal year 2019, the BSF grew slightly to $107.2 million but stayed about flat as a percentage of General Fund revenues. For the 2020 fiscal year, the adopted budget set aside $7 million to be deposited into the BSF.
Click the chart below to view the performance of the Reserve Fund and Budget Stabilization Fund, both in dollar terms and as a percentage of budgeted General Fund revenues.
Open the Reserve Fund and Budget Stabilization visualization (opens in a new tab)
Debt
The City’s Debt Management Policy establishes guidelines for the structure and management of the City’s debt obligations. These guidelines include a non-voter-approved debt service cap of 6% and a total debt service cap of 15% as a percent of General Fund revenues.
The City’s total indebtedness and debt service obligations increased slightly for the first time since 2012, due primarily to the issuance of Proposition HHH General Obligation Bonds.
Open the Debt Service Ratios visualization (opens in a new tab)
Cover Letter
October 17, 2019
Honorable Eric Garcetti, Mayor
Honorable Members of the Los Angeles City Council
Re: Preliminary Financial Report for Fiscal Year 2018-19
Each fall, the Controller’s office submits the Preliminary Financial Report covering financial operations for the City of Los Angeles for the previous fiscal year. Our report is the City’s first review of municipal finances after the close of the fiscal year, providing an overview and analysis of revenues and expenditures, reserves and bonded indebtedness. In January 2020, my office will follow up by issuing the City’s Comprehensive Annual Financial Report for 2018-19, which is prepared in accordance with Generally Accepted Accounting Principles and externally audited by a firm of certified public accountants.
Accompanying the current Preliminary Financial Report is an online interactive tool for exploring revenues and expenditures, with 10 years of data. Information on special fund balances and uses, Reserve Fund starting balances over the years, and budget appropriations, adjustments, expenditures and revenues, are also available on our website.
The substance and timing of this report make it a vital tool for City leaders to use to assess the overall health of the City’s finances. Knowledge and understanding of the revenue and expenditure trends, the condition of the City’s reserves, and the outstanding debt — all of which are discussed in the report — are critical to ensuring responsible financial management.
A solid year
Highlighted in the Preliminary Financial Report are these facts about the 2018-19 fiscal year:
- Total revenues increased by 8.6 percent to $9.08 billion, while total expenditures rose by 4.5 percent to $8.23 billion. Revenue growth was fueled by all-time high property, business, sales and transient occupancy tax receipts.
- General Fund revenues grew by 7.2 percent to $6.23 billion, while non-proprietary special funds expanded by 11.6 percent to $2.85.
- The Reserve Fund balance ended at 6.2 percent of General Fund receipts anticipated in the 2019-20 Adopted Budget, leaving the City $79 million above its five percent policy goal.
- Cannabis related revenue totaled more than $70 million due to higher than expected business and sales tax receipts.
Concerns remain
A number of concerns are also addressed in the report:
- Pension costs to the City increased last fiscal year by 9.1 percent from $1.1 billion to more than $1.2 billion.
- Total expenditures will continue to grow in the coming years due to increased salary and employee benefit costs in newly-adopted labor agreements. Such costs could put constraints on the City’s ability to expand services in future years, especially if revenues do not keep pace.
- Although transient occupancy tax receipts from hotels and home-sharing increased, they dipped below budgeted amounts for the first time since 2011. The City’s new home-sharing policy, which imposes some limits on short term rentals, could impact the amount collected going forward.
To proactively address these issues, my office recommends that the City further increase the General Fund percentage contributed to the Reserve and Budget Stabilization Funds, and remain cautious when considering future staffing and related spending requests.
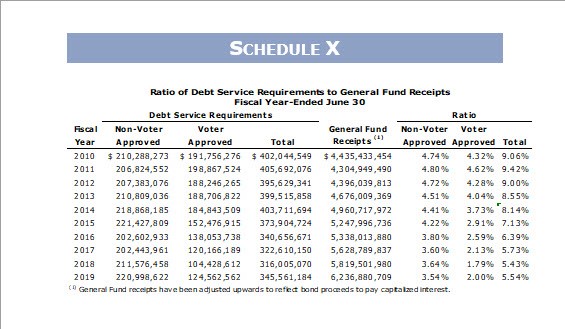
It is also worth noting that City’s debt service requirements increased only slightly to 5.5 percent of General Fund revenues ($345.6 million), due to the issuance of the second round of Proposition HHH bonds last year, but remained significantly below the policy limit of 15 percent ($935.5 million). While this can be viewed in a positive light, utilizing debt financing can also provide the opportunity to invest in large-scale infrastructure projects to meet long-term City needs, including street and sidewalk repair and information technology modernization, as recommended in some of my office’s recent reports.
My staff and I appreciate the cooperation shown by City departments as we prepared this report, and we congratulate them for smoothly closing the last fiscal year.
Respectfully submitted,

L.A. Controller
cc: Sharon Tso, Chief Legislative Analyst
Richard H. Llewellyn Jr., City Administrative Officer
Executive Summary
At the close of each fiscal year, the Office of the Controller is required to report on the finances of the City for the year that just ended. This Preliminary Financial Report is the first piece of that reporting provides cash basis information on revenues, expenditures, reserves, and bonded indebtedness, in comparison to the Adopted Budget.
The second piece of this reporting requirement is the Comprehensive Annual Financial Report (CAFR), the City’s official, audited financial statement, which will be released later this fiscal year. Together, these two documents educate and inform both City decision-makers and the public on the City’s financial situation.
Fiscal Year 2018-19, which ended on June 30, 2019, was a strong year for the City’s finances. Total revenues grew faster than historical averages, while total expenditures grew slightly less than the long-term trend. Reserves were maintained well above the City’s policy minimums and debt service obligations remained far below legal limits. However, as discussed in the Report, newly-contracted salary increases, continuing demands for expanded services, and other future obligations will make this strength difficult to maintain in the years to come, while crowding out much needed investment in critical infrastructure maintenance and improvement.
Fiscal Year 2019 at a Glance
Strengths:
- Total Revenues up 8.6% while Total Expenditures up 4.5%
- 2% Reserve Fund provides more than $209 million for contingencies.
- Health costs increased by only 5%, slower than prior years.
- Cannabis-related revenue totaled over $70 million.
Weaknesses:
- Pension costs grew by 9.1%
- Capital Improvements spending only 44% of budget
- Documentary Transfer Tax fell slightly for the second straight year
Trends to Watch:
- New MOUs will increase salaries significantly
- Will hotel demand and prices stay high? And what impact will the new home-sharing policy have on tax revenue?
With sales volumes falling, can Property Tax continue to grow at more than 6% annually?
The Preliminary Financial Report is organized in four distinct sections:
- Revenues and Expenditures: A discussion of the fiscal year that just ended, including trend analysis, notable changes from prior years, and financial performance relative to the Adopted Budget
- Reserve Fund: A discussion of the current condition of the City’s Reserve Fund, and analysis of the various factors influencing that figure
- Budget Stabilization Fund: A discussion of the Fund policy and how actual figures compare to the policy
- Bonded Indebtedness: A statement of the City’s total bonded indebtedness and debt service requirements; as well as comparisons to City policies and legal limitations
- Revenues and Expenditures
Total Revenue grew by 8.6 percent over the prior year. General Fund revenue increased by 7.2 percent, led by record high receipts from Property Tax, Business Tax, Sales Tax, and Licenses, Permits, Fees, and Fines. Revenue in budgeted special funds increased by 11.6 percent, led by Sewer Construction and Maintenance, Solid Waste Resources, and the first full year of the Road Maintenance and Rehabilitation Program (SB 1).
Total expenditures grew as well, at a rate of 4.5 percent, led by salary and pension contribution increases partially offset by reduced spending on capital projects.
Revenues have been growing at a relatively strong pace for a number of years, but signs of weakening are present, including stagnant receipts from Documentary Transfer Tax and Transient Occupancy Tax from hotels. Expenditures, however, are projected to grow at a higher rate over the next two years due to new employment contracts with virtually all City employees including significant cost of living increases over the next three years, in addition to projected increases in health care costs and retirement contributions.
Combining these projected increases with the constant demands for greater service levels and new initiatives, and deferred maintenance, the City may face significant challenges when the impacts of a slowing national and international economy begin to negatively affect the City’s revenues.
- Reserve Fund
The key to preparing for future downturns is to increase the City’s reserves during years of strong growth. In the last ten fiscal years, with a combination of strong revenue growth and fiscal restraint, the Reserve Fund balance rose from 3.9 percent in 2009-10 to its 8.2 percent peak at the beginning of 2015-16, but has since declined to 6.2 percent of the 2019-20 Adopted General Fund Budget.
Since 2015, efforts to balance the budget, fund new priorities and cover unanticipated expenditures have cut into these reserves. While this amount is above the City’s policy goals, the decline in reserves does not correlate to the significant economic growth the City has experienced during this period. The current balance in the Reserve Fund leaves $79 million available to meet unanticipated needs without dropping below the City’s 5 percent Reserve Fund policy.
- Budget Stabilization Fund
The Budget Stabilization Fund is the City’s mechanism for accumulating excess tax revenues in growth years in order to mitigate shortfalls in lean years. The June 30, 2019 balance in the Fund was $107.2 million. As in prior years, deposits into the Fund were reduced in order to meet other City Financial Policies, notably the capital improvement funding requirement, though even with the offsets the budget is not in compliance with the policy. The Mayor and Council are currently working with the City Administrative Officer (CAO) and the City Attorney to revise the policy to better reflect the City’s needs and financial situation.
- Bonded Indebtedness
After four consecutive years of decreases driven by low interest rates and debt refunding, bonded indebtedness and the City’s debt service obligations increased due to the issuance of Proposition HHH bonds. Debt service payments increased from 5.4 percent to 5.5 percent of General Fund revenue, still well under the City’s 15 percent policy ceiling.
This low level of debt, combined with historically low interest rates, presents the possibility of debt financing much needed improvements in City facilities, technology infrastructure, and street, sidewalk, and safety projects. As long as additional debt is issued responsibly and strategically, this can be a valuable tool for financing long term investment in the City’s future.
Section I: Revenues and Expenditures
The Preliminary Financial Report focuses on the cash basis financial information of the City for 2018-19, providing information on revenues and expenditures, the Reserve Fund, the Budget Stabilization Fund, and bonded indebtedness.
Audited financial statements, prepared in conformity with Generally Accepted Accounting Principles (GAAP), will be presented in the City’s Comprehensive Annual Financial Report (CAFR) later this fiscal year.
Total Revenues in budgeted funds for 2018-19 were $9.08 billion, an increase of 8.6 percent over 2017-18, while total expenditures increased by 4.5 percent to $8.23 billion. In addition to the expenditures, the City encumbered $618 million. However, with recently approved cost of living increases, many of which are retroactive, along with projected increases in other costs, the gap between revenues and expenditures will shrink in future years unless revenues exceed expectations. Exhibit 1 shows the ten-year history of total revenues and expenditures.
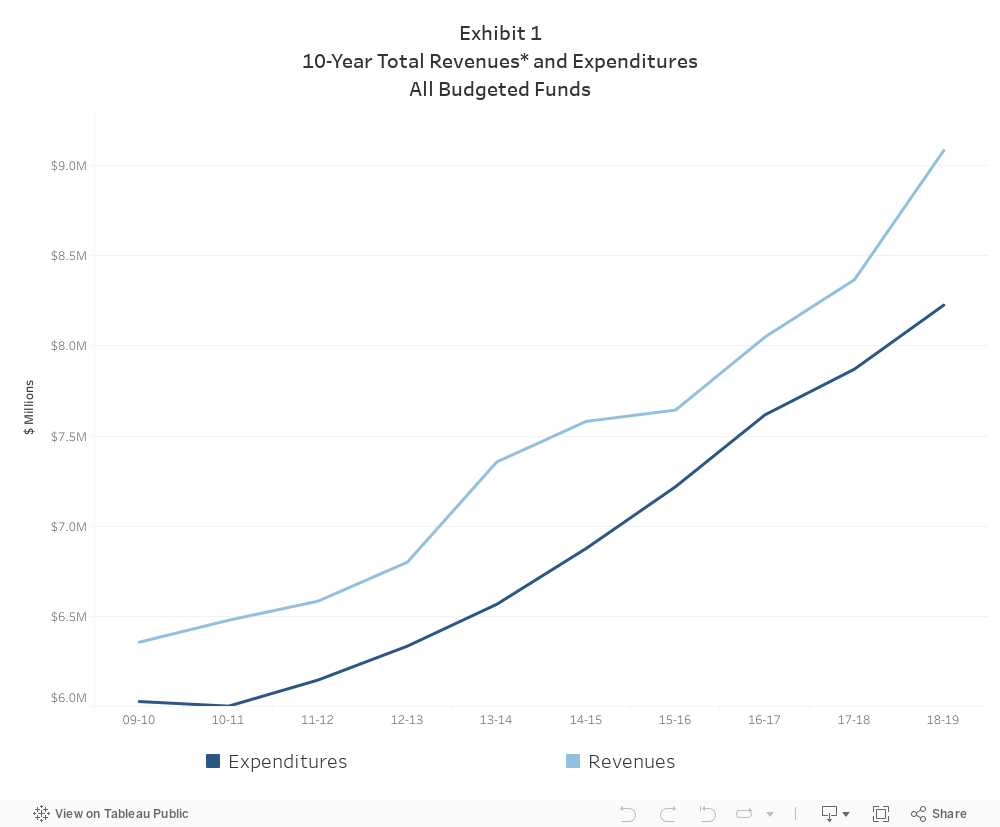
Since 2009-10, revenues have grown by 42.9 percent (average annual growth of 4.1 percent), while expenditures have grown by 36.5 percent (average annual growth of 3.4 percent). However, as seen in Exhibit 1, the two sides never diverge for very long. When expenditures exceed revenues, the City implements costs controls and seeks new revenue sources; when revenues exceed expenditures, new and expanded initiatives get funded.
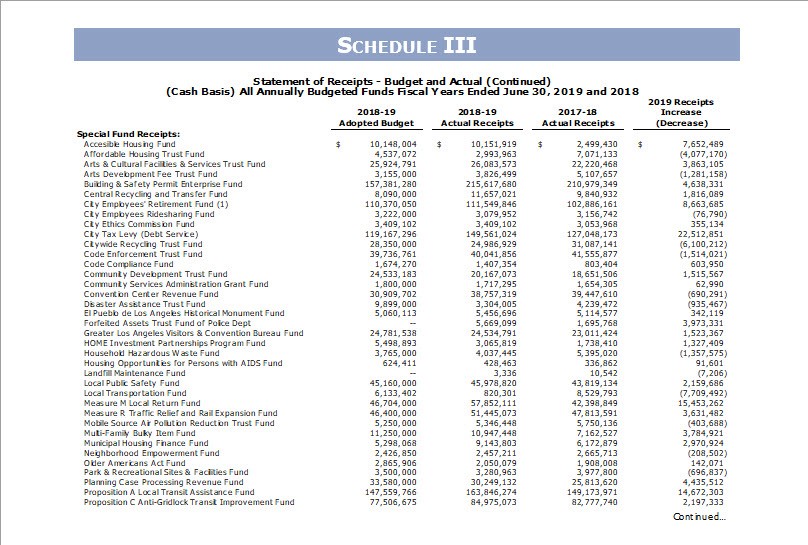
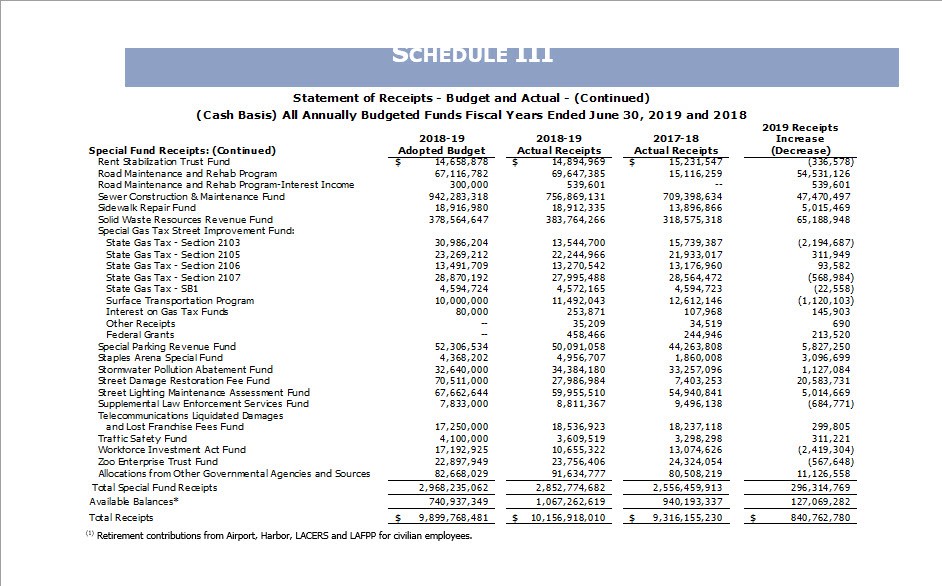
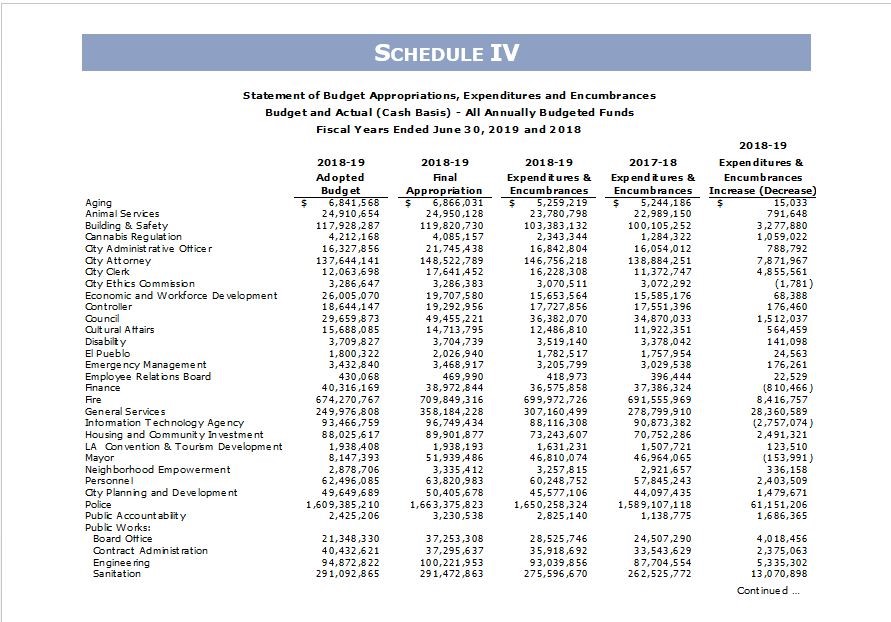
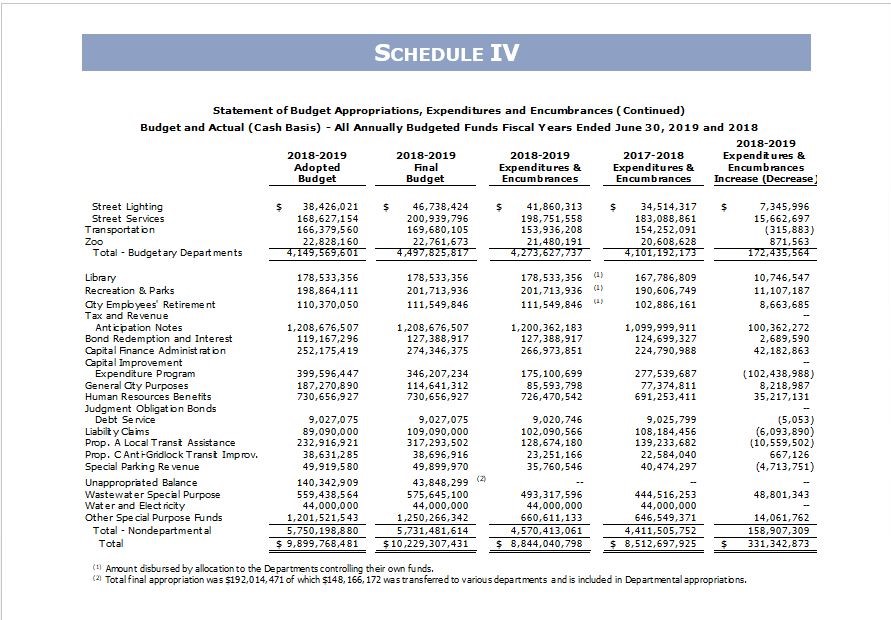
The 2018-19 Adopted Budget totaled $9.16 billion (excluding $740.9 million in available balances), of which $6.19 billion was in the General Fund and $2.97 billion was in Special Funds. Actual receipts for the year (excluding available balances) were $9.08 billion, 0.76 percent less than budgeted, while total expenditures (including encumbrances) were $8.84 billion, 10.7 percent less than budgeted. Detail of budgeted and actual receipts and expenditures is presented in Schedules III and IV.
General Fund Revenues
The General Fund is the primary operating fund of the City. It is used to account for all financial resources except those legally required to be accounted for in other funds. General Fund revenues are derived from such sources as taxes, licenses, permits, fees, fines, intergovernmental revenues, charges for services, special assessments, and interest income. Exhibit 2 presents 2018-19 actual General Fund revenues by percentage.
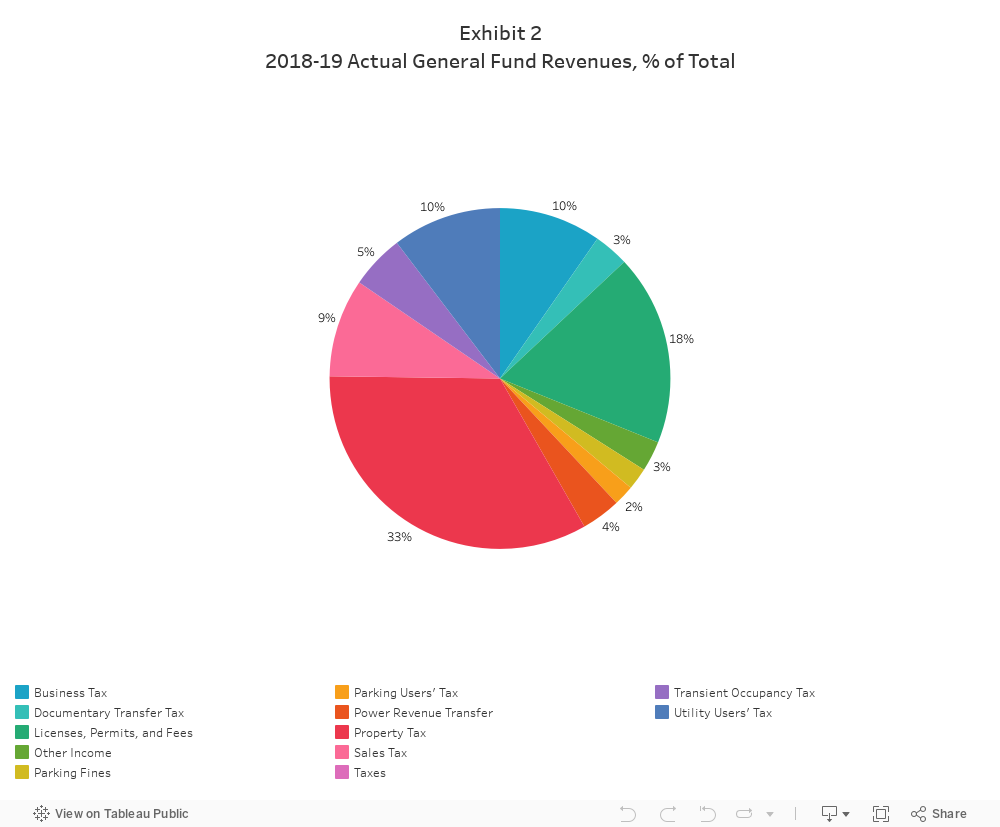
Actual 2018-19 General Fund receipts, excluding transfers from the Reserve Fund, totaled $6.23 billion, $46.3 million (0.8 percent) more than the Adopted Budget and $420.7 million (7.2 percent) more than 2017-18. Over the past five years, General Fund revenue averaged 5.0 percent growth, exceeding the Budget three times and coming up short twice. Exhibit 3 presents a comparison between adopted and actual General Fund receipts by fiscal year.
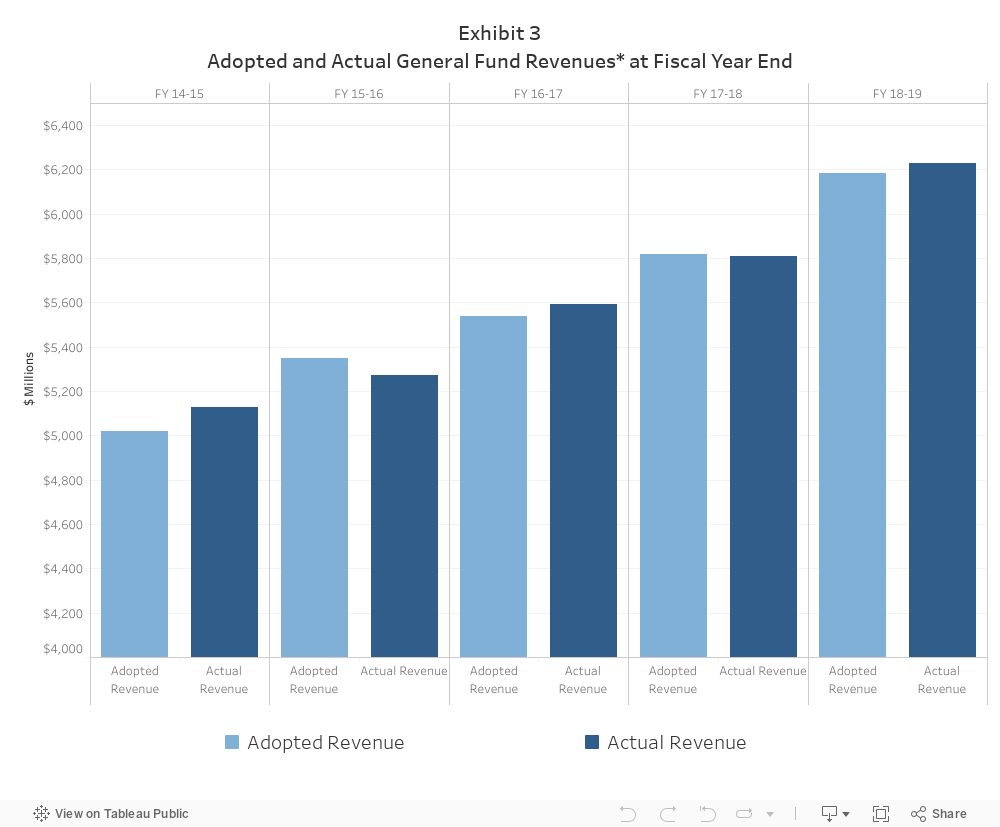
General Fund revenues that outperformed the Adopted Budget included Property Tax ($49 million or 2.5 percent above budget), Business Tax ($13.1 million or 2.2 percent), Sales Tax ($23.5 million or 4.2 percent), Franchise Income ($5.5 million or 7 percent), and Parking User’s Tax ($2.5 million or 2.15 percent).
Property Tax receipts exceeded expectations due to strong growth in assessed property values, $158.7 million (8.6 percent) higher than 2018 receipts. Ex-CRA property tax increment revenue was $23.3 million less than budget and $14.5 million less than the prior year due to delayed property sales and an anticipated tax settlement that was not completed during the fiscal year.
The Adopted Budget assumed 6.4 percent growth for Business Tax receipts. However, due to greater market share of recreational cannabis retail activity ($43.5 million or 7.2 percent of total Business Tax) and moderate growth in non-cannabis business tax, actual receipts were 8.8 percent higher than last year and $13.1 million over budget.
New cannabis retail activity had a positive effect on Sales Tax Receipts as well. Along with delayed prior year remittances and out of state receipts, Sales Tax receipts exceeded the budget by $23.5 million or 4.2 percent, increasing to a total of $581.4 million.
Franchise Income ended higher than budget by $5.5 million, mainly due to natural gas and cable franchise fees that exceeded budget by $3.2 and $1.6 million respectively.
Utility Users’ Tax had a net increase of 0.4 percent. While Gas Users and Electrical Users Taxes combined exceeded the budget by $19.6 million, Telephone Users Tax receipts were $17 million under budget, continuing a decade-long downward trend as both telephone prices and usage decline.
After two consecutive years of shortfalls, Licenses, Permits, Fees and Fines ended slightly higher than budget ($1.7 million or 0.15 percent), boosted by an unbudgeted $26.9 million one-time payment from the Santa Monica Mountains Conservancy relative to Taylor Yard.
These higher than expected revenues were offset by shortfalls in a number of other categories.
Transient Occupancy Tax (commonly known as Hotel Tax) receipts increased by 6.6 percent over last year, but fell under budget first time since 2011, missing the target by $3.3 million or 1 percent. While Transient Occupancy Tax receipts from hotels grew only 2.9 percent, total growth was driven up by revenues collected from short-term rental companies under negotiated tax collection agreements. It should be noted that the City’s newly-implemented home-sharing policy, which will restrict the number of properties and rental days that private dwellings will be available on short term rental market, may impact Transient Occupancy Tax going forward.
Documentary Transfer Tax receipts were short $8.3 million or 3.9 percent compared to the budget and $1.6 million or 0.8 percent compared to last year. This second straight slight decrease was a result of declining sales offset by continuing increases in sale prices.
The Power Revenue Transfer was $5.4 million (2.3 percent) less than budget. It has been declining slowly since 2016, with a 4.4 percent average decrease over the last three years.
Exhibit 4 below displays a 10-year history of General Fund receipts, excluding transfers from Reserve Fund.
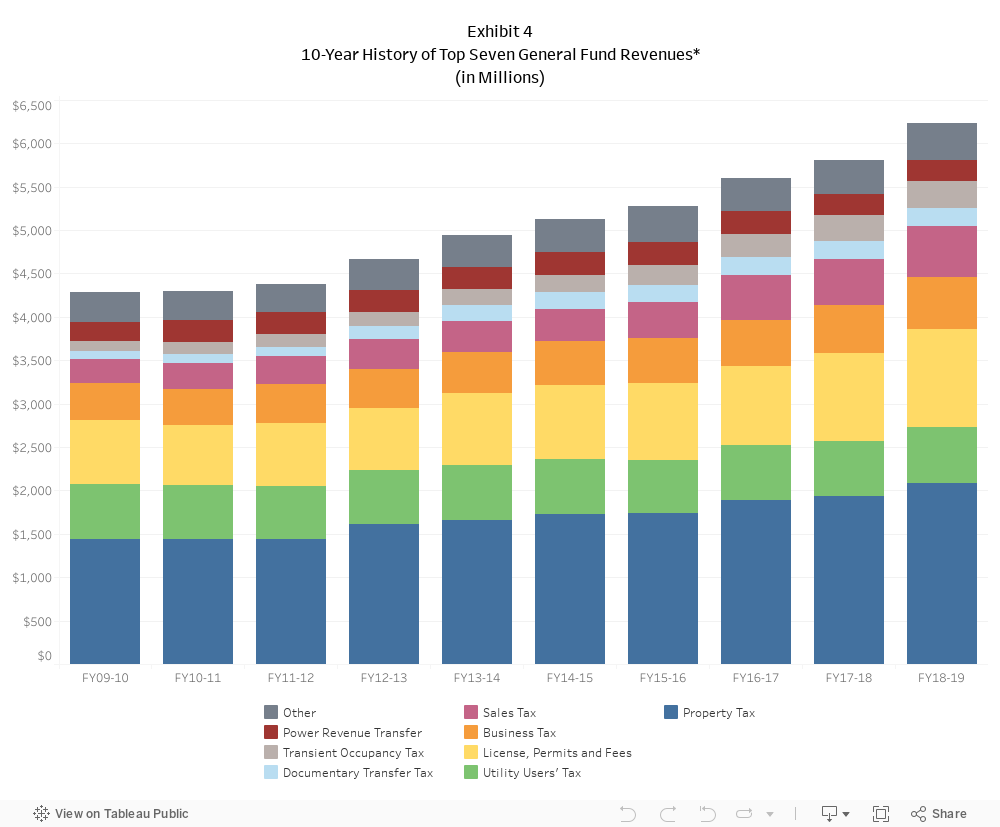
Revenues have steadily increased from 2011-12 (average annual growth of 4.3 percent). In 2018-19, these revenues exceeded prior year actual receipts by $420.6 million or 7.2 percent.
Not only did Property Tax, Sales Tax, Business Tax, and Transient Occupancy Tax achieve all-time highs, the year-over-year growth percentage in these categories trended higher as well. Property Tax growth percentage increased from 2.4 percent to 7.4 percent in the current year. Sales Tax receipts grew by 9.8 percent compared to 1.8 percent increase in 2017-18. Business Tax continued its steady rise with 8.8 percent increase in 2018-19, compared to 5 percent increase last fiscal year, and 3.6 percent in 2016-17. Transient Occupancy Tax revenue was the exception among the major taxes, with 6.6 percent growth compared to 12.6 percent in 2017-18.
Documentary Transfer Tax receipts, considered the most volatile of the General Fund taxes, recorded robust growth in the aftermath of the economic recession as property values recovered and sales accelerated, increasing by a total of 134 percent between 2009 and 2015. Since then, receipts have grown only 4.8 percent, and have actually decreased slightly over the past two years. Since Documentary Transfer Tax is a transaction-based tax, both prices and volume must increase for significant gains. For the past two years, prices have continued to rise but declining sales volume has pulled down tax receipts.
In past years, a drop in Documentary Transfer Tax receipts has served as a leading indicator of an imminent recession. Since it was established in the early 1990s, it has dropped four times. Each of the first three drops preceded periods of overall economic contraction. It remains to be seen whether the slight declines of 2018 and 2019 repeat this pattern.
Appropriations, Expenditures & Encumbrances
Total expenditures, including encumbrances, were $8.84 billion. This was $331.3 million or 3.9 percent higher than the 2017-18, but $1.06 billion or 10.7 percent lower than the Adopted Budget.
Exhibit 5 presents a comparison between the Adopted Budget, the final budget (which includes interim appropriations made during the year), and actual expenditures and encumbrances by fiscal year.
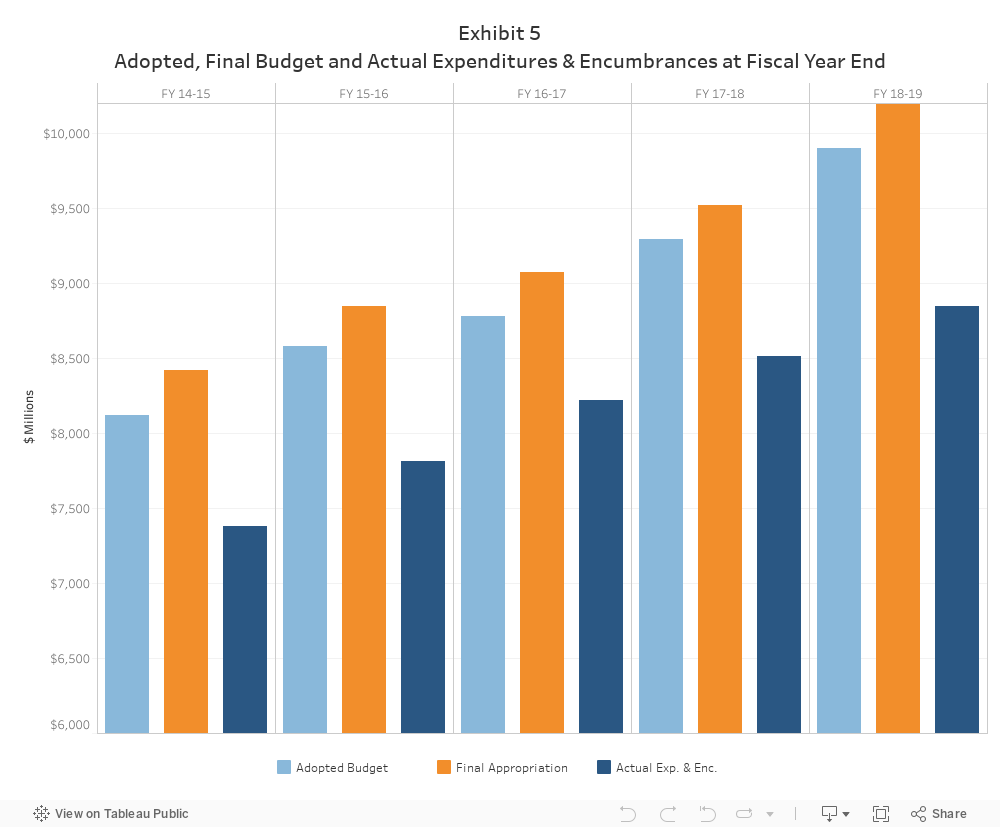
For the last five years total actual Expenditures and Encumbrances have grown average 4.8 percent. For the same period, Salaries ( excluding Library and Recreations and Parks) increased by 4.2 percent, and Services, Supplies, Equipment and Others by 5.2 percent. Salaries are made up of Sworn and Civilian Salaries, which increased by 4.5 and 3.8 percent respectively.
Exhibit 6 breaks out summarized categories of budgetary and actual expenditures and encumbrances for 2017-18 and 2018-19. Detailed information by department can be found in Schedule IV.
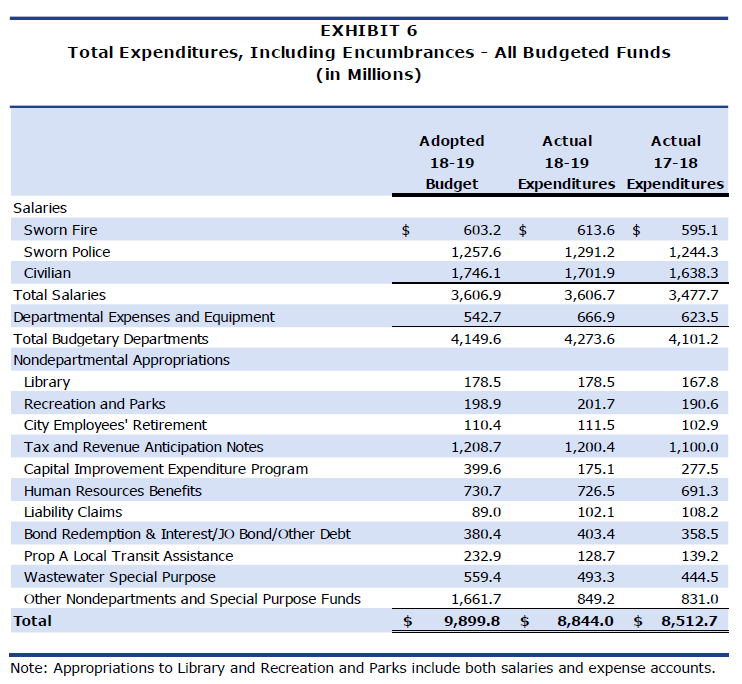
Salaries increased by $129 million or 3.7 percent compared to last year. This would have been higher, but anticipated expenditures from pending labor agreements did not materialize in the current year due to the timing of execution of those agreements. Due to the retroactive nature of some of those agreements, the impact anticipated in 2018-19 will be added to 2019-20 salary growth.
Total contributions to Library and Recreation and Parks, which increased by a $10.7 million or 6.4 percent and $11.1 million or 5.8 percent respectively, are made pursuant to Charter requirements and are tied to growth in the City’s total assessed valuation.
Capital Improvement Expenditure Program (CIEP) expenditures were 56.2 percent or $224.5 million lower than budget, and $102.4 million lower than last year. The largest variance from last year was in Clean Water System Projects, which was 54.2 percent or $178.8 million lower than the budget and 41 percent or $104.9 million lower than last year.
Human Resources Benefits expenses were slightly lower than the budget (0.6 percent), but higher by $35.2 million or 5.1 percent compared to last year. The increase was primarily due to increases in Health care subsidies for civilian and sworn employees, by $24.4 million or 5.2 percent, and Worker’s Compensation costs, which increased by $9.8 million or 5.2 percent.
Exhibit 7 breaks out expenditures and encumbrances by Governmental Activity.
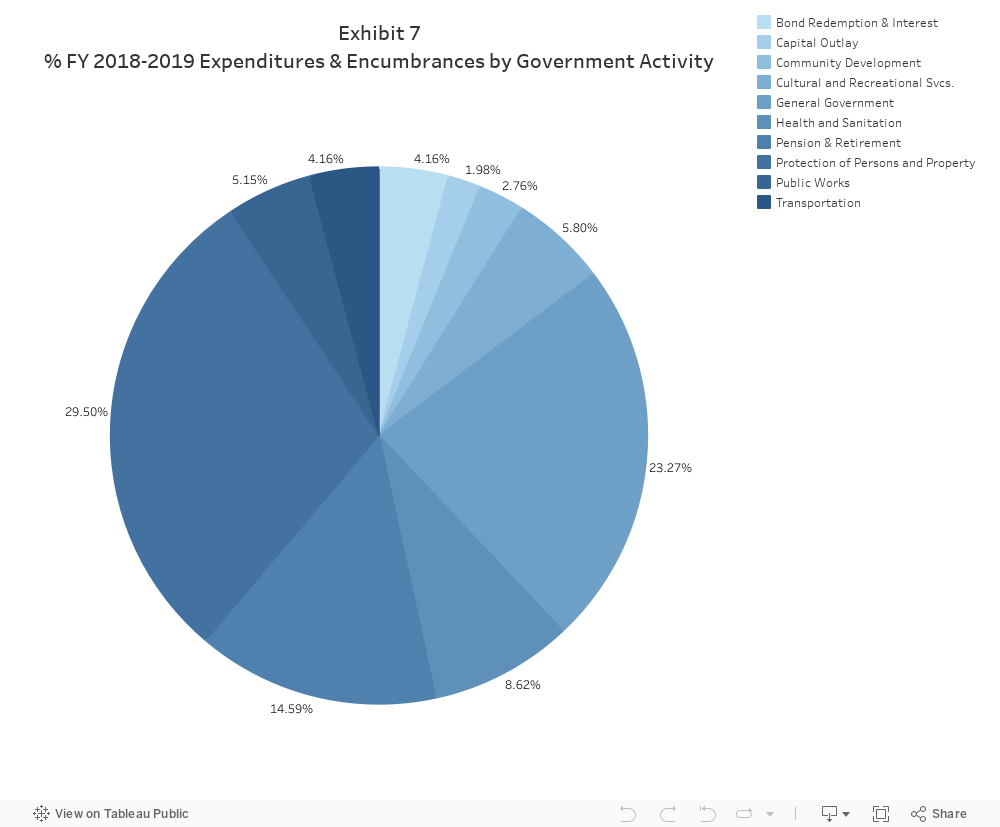
Almost a third of total expenditures were spent on Protection of Persons and Property. Even as priorities have shifted and the economy has grown, this percentage has remained remarkably stable.
Also of note were the contributions to the City’s pension systems, which totaled $1.3 billion, 15% of total spending. This is down slightly from recent years, but still a figure that should be monitored carefully.
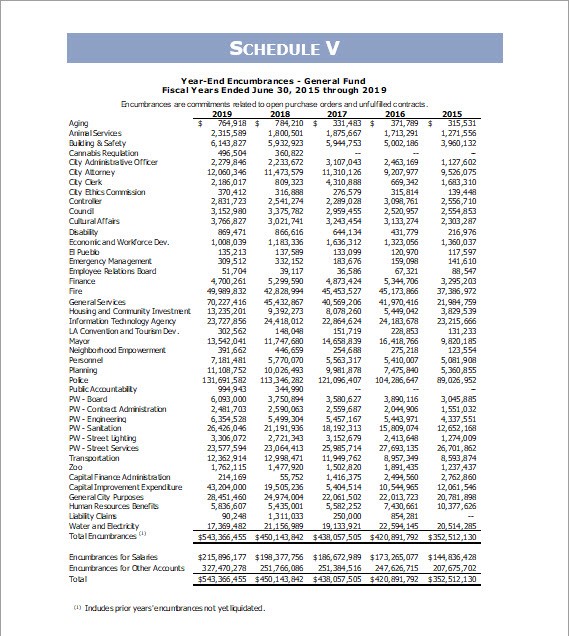
The City ended the fiscal year with a total of $617.9 million in encumbrances: $543.4 million in the General Fund and $74.5 million in special funds. $215.9 million was encumbered for salaries to be paid in July 2019, with the balance encumbered in expense, equipment, and special fund project accounts.
Encumbered funds for salaries are earmarked for the last pay period of the fiscal year and unspent funds are immediately released after payroll is made. Funds encumbered for expense accounts are continued across fiscal years to ensure that cash is available to cover the expenditure when it is made. Schedule V provides a listing of General Fund encumbrances by department.
The General Fund Encumbrance Policy provides that encumbered funds that remain unspent for a period longer than one fiscal year shall be disencumbered every fiscal year, with the exception of capital project funds. Prior-year encumbrances are automatically disencumbered unless exempted by Mayor and Council approval. As part of the 2018-19 Year-End Financial Status Report, a total of $38.9 million was exempted from disencumbrances, a decrease of $6.0 million from last year’s exemptions.
Unencumbered General funds revert to the Reserve Fund at year end. As such, exemptions to the automatic disencumbrance policy reduce reversions, thereby reducing the cash available in the Reserve Fund to pay for emergencies and contingencies. Section II below discusses the status of the Reserve Fund in more detail.
Section II: Reserve Fund
The Reserve Fund is established to ensure that funds are available for unanticipated expenditures and revenue shortfalls in the General Fund, and is broken into an Emergency Account and a Contingency Account.
The Emergency Reserve Account is fixed at 2.75 percent of the adopted General Fund receipts. A finding of urgent economic necessity is required to use these funds. The Contingency Reserve Account includes all monies in the Reserve Fund over and above the amount required to be allocated to the Emergency Account. Contingency Reserve Account funds can be a source of additional funding to cover unanticipated expenses or revenue shortfalls.
The City’s Reserve Fund Policy (CF 98-0459) sets a Reserve Fund cash balance goal of at least 5.0 percent of budgeted General Fund receipts. Exhibit 8 displays the past ten years of beginning Emergency and Contingency Reserve Fund balances compared to this policy target.
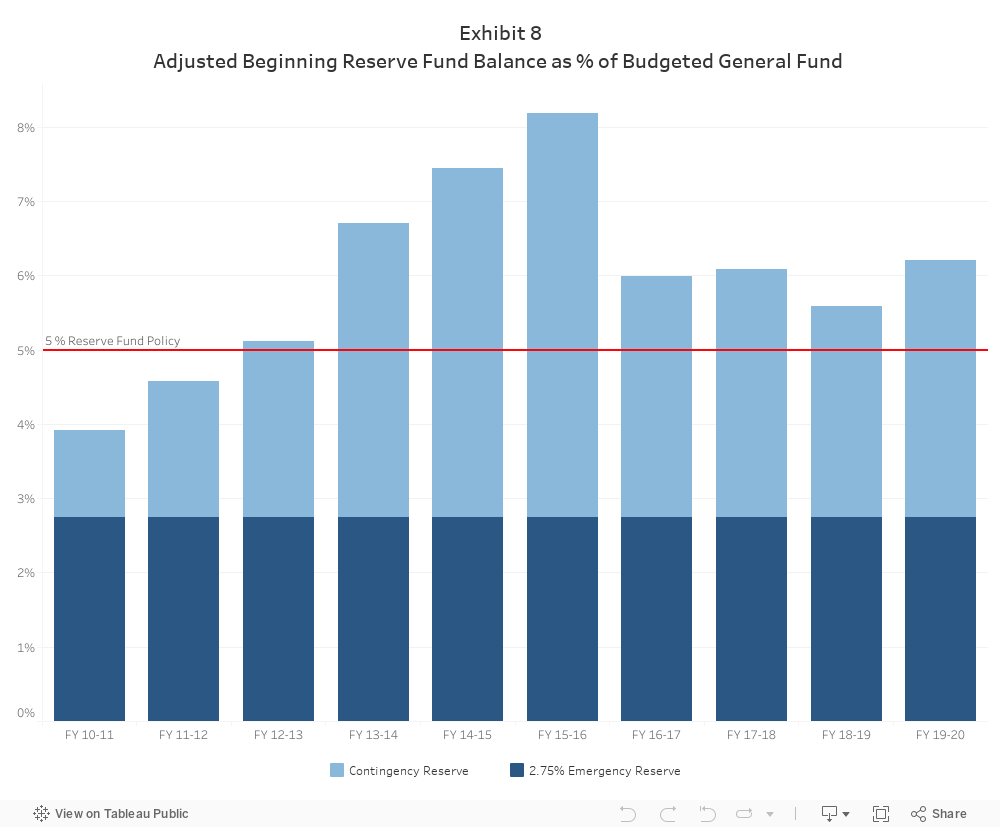
The Reserve Fund is an important measure of the City’s fiscal health, and is vital to cash flow, bond ratings, and the ability to manage financial challenges.
Failure to maintain the City’s Reserve Fund at an adequate level not only exposes the City to significant risk in the event of an emergency, but can also have negative financial impacts due to increased cost of borrowing. Just as growing the Reserve Fund has been a factor in upgrades in past years, dropping below the 5.0 percent policy would likely be viewed negatively by rating agencies.
Reserve Fund Status
After the 2018-19 accounting close, budgetary appropriations, return of advances, and reappropriations, and the fiscal year-start adjusted Reserve Fund balance was $407.3 million or 6.2 percent of General Fund receipts anticipated in the 2019-20 Adopted Budget, $78.8 million above the 5.0 percent Reserve Fund Policy goal.
Exhibit 9, below, shows Adopted and Actual Beginning Reserve Fund Balances for last ten years.
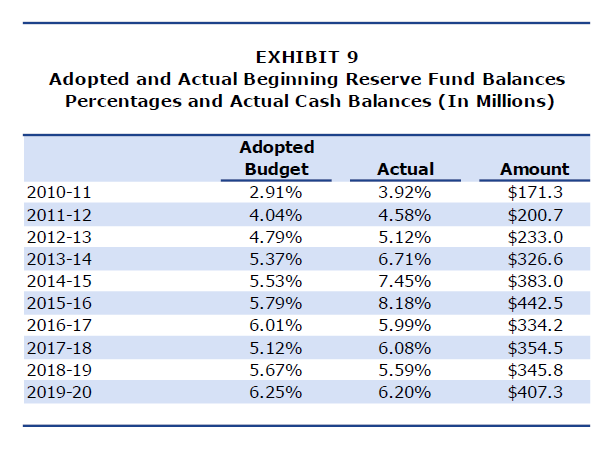
The Reserve Fund balance increased significantly from 2010-11 to 2015-16, hitting 8.18 percent in 2015-16. Since then, the percentage has varied in the 5.5 to 6 percent range, less than prior years but still above the policy minimum. The 2019-20 year-start Reserve Fund is $3.1 million lower than the $410.4 million assumed in the Adopted Budget, primarily due to higher than anticipated advances to other funds and higher than normal reappropriations and year-end borrowing.
Adjustments to the Reserve Fund Cash Balance
At the end of each fiscal year and the beginning of the next, a number of transactions are required to accurately reflect the status of the Reserve Fund through the closing of the City’s books. Exhibit 10 details the year-end and year-start adjustments to the Reserve Fund Cash Balance, comparing Adopted Budget versus actual.
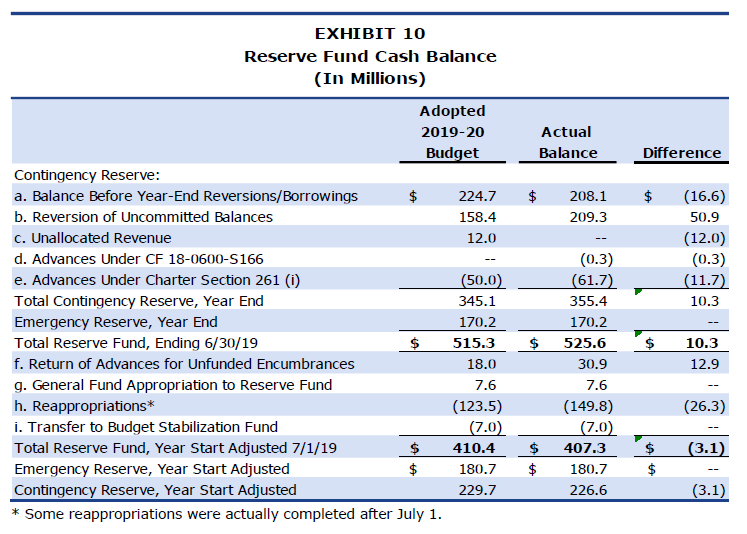
Following are descriptions of the line item changes to the Reserve Fund listed in Exhibit 10:
Reserve Fund Cash Balance (June 30, 2019)
As of June 30, 2019, after closing the City’s General Ledger, the recorded Reserve Fund balance was $407.3 million. This was $3.1 million less than the amount anticipated in the 2019-20 Adopted Budget. The Reserve Fund cash balance is adjusted by the following factors to arrive at the year-end balance:
a. Balance Before Year-End Reversions/Borrowings
The amount of cash available in the Contingency Reserve prior to adjustments for year-end reversions, unallocated revenues, and borrowings. It does not include cash in the Emergency Reserve.
For 2018-19, this amount was lower than anticipated in the budget due to higher than anticipated advances to other funds made after the adoption of the budget.
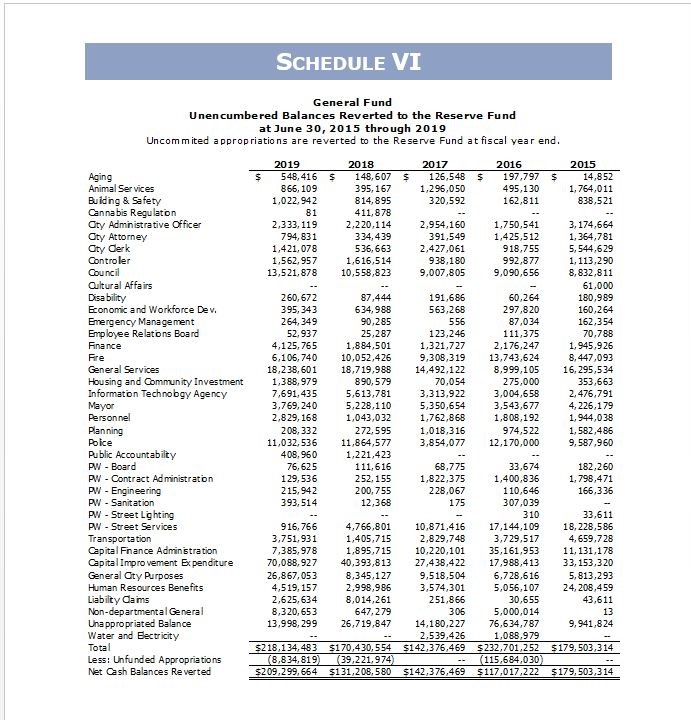
b. Reversion of Uncommitted Balances
Uncommitted General Fund appropriations are reverted to the Reserve Fund at fiscal year-end. Appropriations (spending authority) granted to City departments by the Mayor and Council are committed throughout the year in the form of encumbrances and expenditures. Remaining or uncommitted balances are reverted to the Reserve Fund to the extent they are supported by cash.
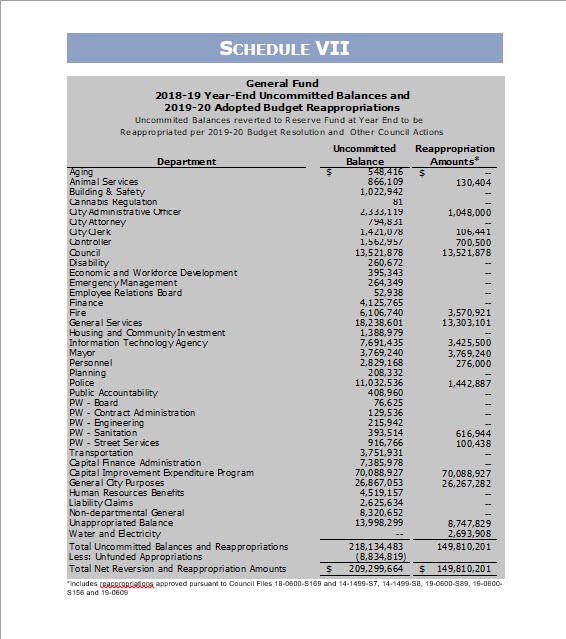
In 2018-19, the budget estimated $158.4 million in reversions. The uncommitted balance at year end was $218.1 million. Excluding unfunded appropriations, a total of $209.3 million reverted prior to reappropriations.
For a detailed breakdown of uncommitted balances by department, please see Schedule VII.
c. Unallocated Revenue (Excess Receipts)
Unallocated revenue occurs when revenues exceed the total budget appropriation. While the Adopted Budget assumed $12 million in surplus receipts would revert to the Reserve Fund in 2018-19, none were realized, resulting in a reduction of the Reserve Fund balance.
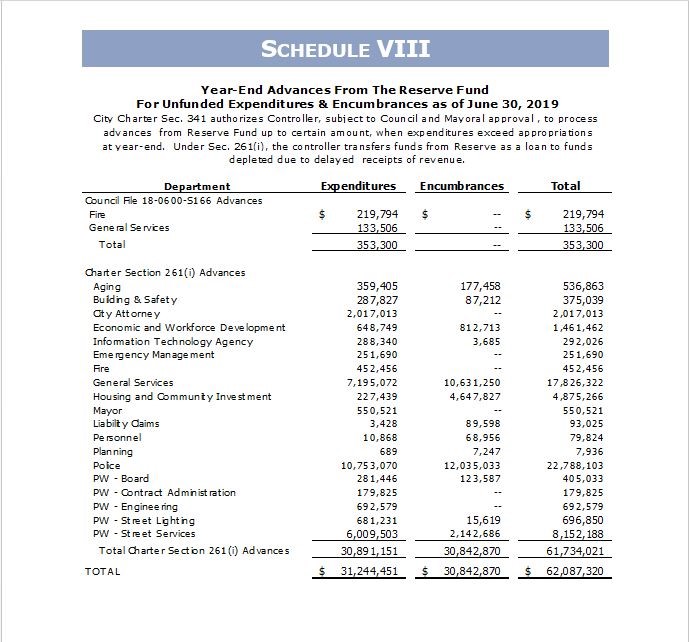
d. Advances Under CF 18-0600-S166
Council File 18-0600-S166 authorized the Controller to borrow from the Reserve Fund at year-end to balance departmental budgets where needed in order to facilitate the closing of the City’s General Ledger. The Controller is authorized to increase appropriations within established limits without getting itemized Mayor and Council approval, a process that would delay the closing of the City’s General Ledger. Advances totaling $353,300 were made for the Fire and General Services departments.
e. Advances Under Charter Section 261(i) for Unfunded Encumbrances and Expenditures
Under Charter Section 261(i), the Controller transfers funds from the Reserve Fund as a loan to any fund that becomes depleted due to tardy receipt of revenue. The 2019-20 Adopted Budget estimated $50.0 million in year-end advances. Actual advances were $61.7 million, consisting of $30.9 million in unfunded expenditures and $30.8 million in unfunded encumbrances (see Schedule VIII for a breakdown by department).
Unfunded expenditures generally occur when expenditures occur prior to receipts (e.g. grants on reimbursement basis) and/or due to billing delays. When the funding source reimburses the costs, departments are able to repay the advances. If funding is not available, departments may request Mayor and Council approval to write-off the advances. Unfunded encumbered amounts represent a technical adjustment at year-end and are reversed at the start of the new fiscal year as documented in item (f), below.
Reserve Fund Cash Balance (2019-20 Year-Start)
The 2018-19 year-end Reserve Fund cash balance is not the same as the 2019-20 year-start cash balance. The following technical adjustments are made after the close of the prior fiscal year.
f. Return of Advances for Unfunded Encumbrances
Advances for unfunded encumbrances are reversed at the start of the following fiscal year, as discussed in item (e), above.
g. Transfer to Budget
The 2019-20 Adopted Budget included an appropriation to the Reserve Fund totaling $7,639,914.
h. Reappropriations
The 2019-20 Adopted Budget and other Council actions (C.F. 18-0600-S169, 14-1499-S7, 14-1499-S8, 19-0600-S89, 19-0600-S156 and 19-0609) provided that certain uncommitted balances earmarked for specific programs would be reappropriated in the subsequent year if not expended by the year-end. See Schedule VII for reappropriations by department.
Actual reappropriations of $152.8 million were $29.3 million above the $123.5 million budget, due primarily to unbudgeted reappropriations for housing and homeless services.
i. Transfer to Budget Stabilization Fund
The 2019-20 Adopted Budget transferred $7.0 million into the Budget Stabilization Fund.
Section III: Budget Stabilization Fund
The Budget Stabilization Fund (BSF) was added to the City’s Charter in 2011. The purpose of this fund is to set aside revenues during periods of robust economic growth or when revenue projections are exceeded to help smooth out years when revenue is stagnant or is in decline.
The June 30 Fund balance was $107.2 million. Exhibit 11 below displays the adopted and prior year cash balance and adjustments of the BSF. As further explained below, the Adopted Budget included a deposit of $7.0 million into the Fund.
The current BSF Policy states that all budgeted growth in combined receipts from seven City “economically sensitive” revenue categories (Property Tax, Utility Users Tax, Business Tax, Sales Tax, Documentary Transfer Tax, Transient Occupancy Tax, and Parking Users Tax) exceeding 3.4 percent in any given year shall be transferred into the BSF.
The Adopted Budget has transferred money into the BSF each year since the Policy was adopted. However, not once has this budgetary transfer been equal to the amount of “economically sensitive” revenue growth above the 3.4 percent threshold. Instead, the BSF Policy has been met by using the available revenue to meet or exceed the CIEP Policy, as specifically allowed in the BSF Policy.
While this action is clearly consistent with the specific language in the Policy, this trend has a muting effect on the BSF and, should a time come when budget stabilization is necessary, there will not be sufficient funds in the BSF to meet that need. 25 percent of the current available balance, the Policy’s limit on annual withdrawals, would only provide $28.6 million, less than 0.5 percent of the annual budget.
Consistent with this Office’s recommendation in the 2018-19 Preliminary Financial Report, the Mayor’s Proposed Budget and the Council’s Budget Resolution instructed the City Attorney to present an ordinance revising the BSF Policy threshold. Concurrently, the City Administrative Officer is developing a revised set of policies for managing the BSF which will hopefully make compliance with the Policy easier while ensuring sufficient monies are in the Fund when the City needs them.
Section IV: Bonded Indebtedness
The City’s Debt Management Policy establishes guidelines for the structure and management of the City’s debt obligations. These guidelines include target and ceiling levels for certain debt ratios to be used for planning purposes. The two most significant ratios are a non-voter-approved debt service cap as a percent of General Fund revenues of 6 percent and a total debt service cap as a percent of General Fund revenues of 15 percent.
Exhibit 12, below, illustrates the City’s compliance with these debt management policies the past five years.
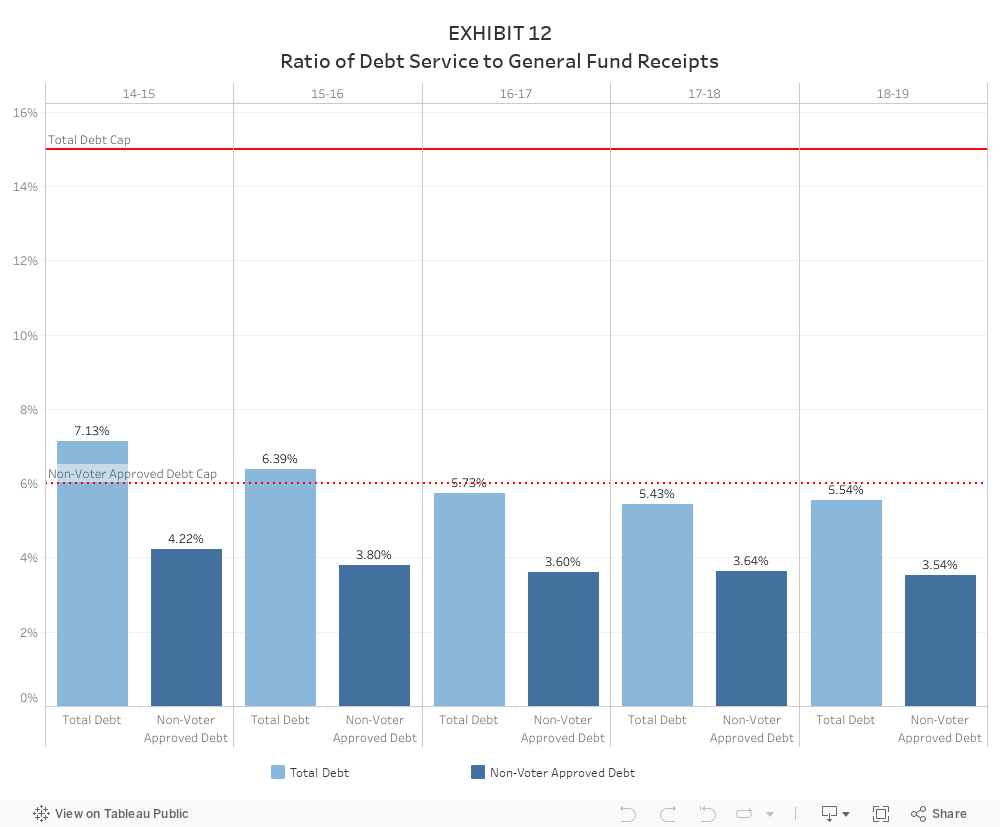
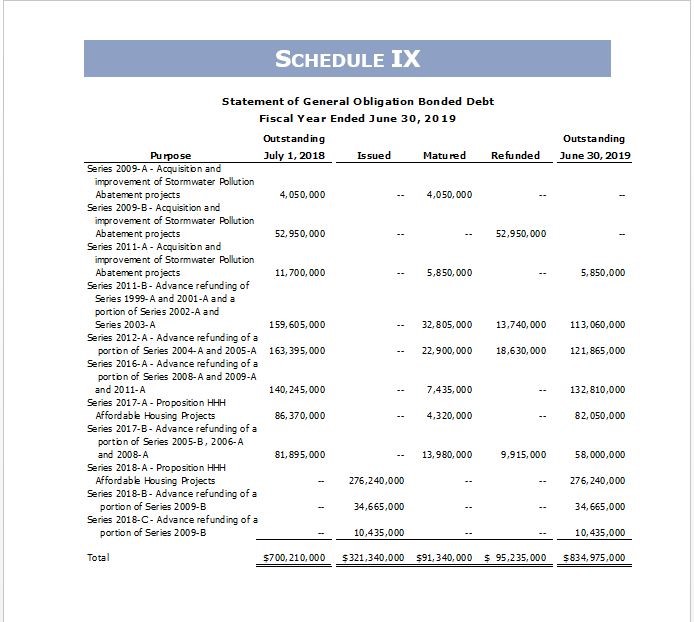
The actual ratio of Debt Service to General Fund Receipts was 5.54 percent in 2018-19. The ratio increased because the City issued Series 2018-A General Obligation Bonds, providing fund in the amount of $276 million for Proposition HHH Housing and Homeless Facilities projects. This increase reversed a significant long term trend, as the past ten years have seen the City refinance the vast majority of its debt portfolio while not authorizing any new general obligation bonds. As shown on Schedule IX, Statement of General Obligation Bonded Debt, City refunded $53 million and defeased (paid off) $42.3 million during the year.
Exhibit 12 shows very clearly the responsibility the City has exhibited when it comes to debt management. Consistently falling debt service obligations have put the City in a position to consider major projects, as well as making strategic financing agreements available when these present financial advantages.
This significant amount of debt capacity also indicates an opportunity to invest in large-scale long-term infrastructure projects, including information technology (IT) infrastructure modernization, as identified in the Controller’s Information Technology Disaster Preparedness, Recovery, and Continuity audit. IT systems perform an increasingly critical role in the City’s every day and public safety operations, and the audit emphasized the immediate need for new investments in IT infrastructure.
Schedules
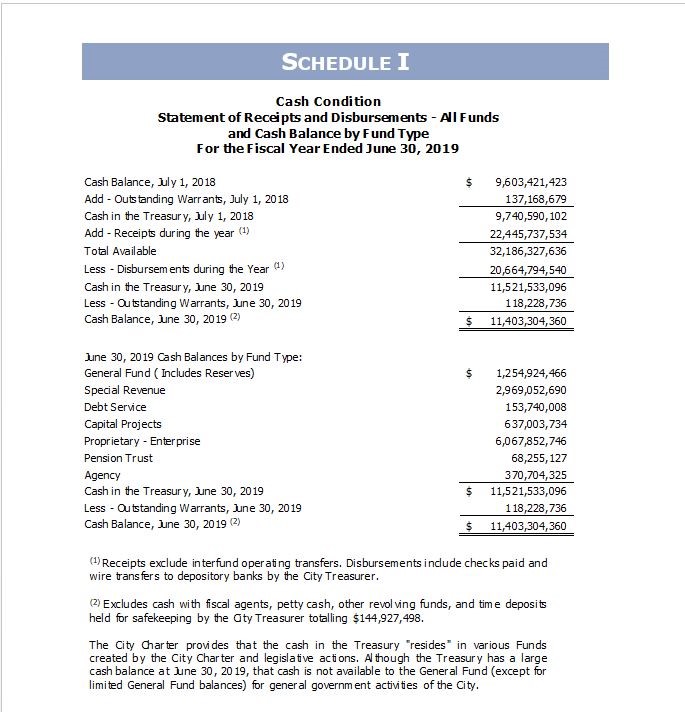
Schedule I: Cash Condition Statement of Receipts and Disbursements
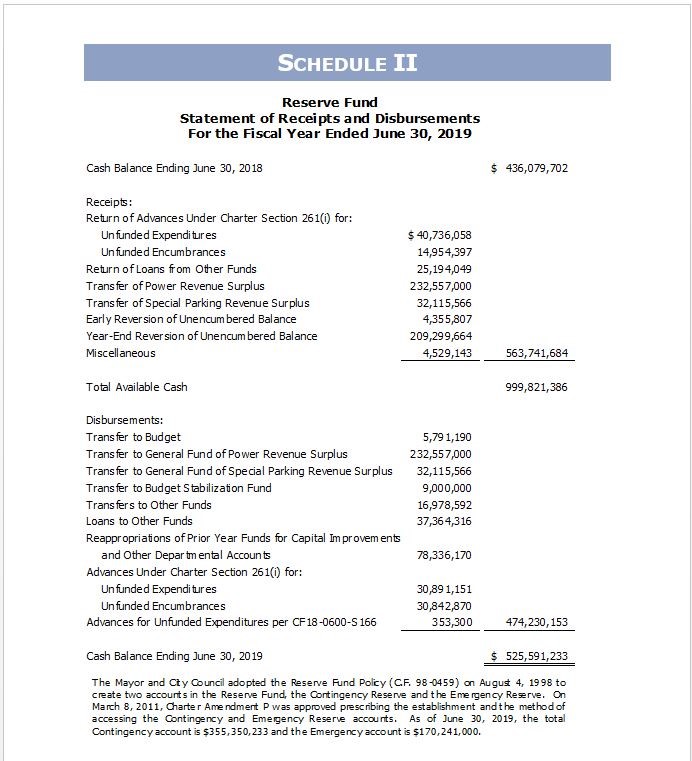
Schedule II: Reserve Fund Statement of Receipts and Disbursements
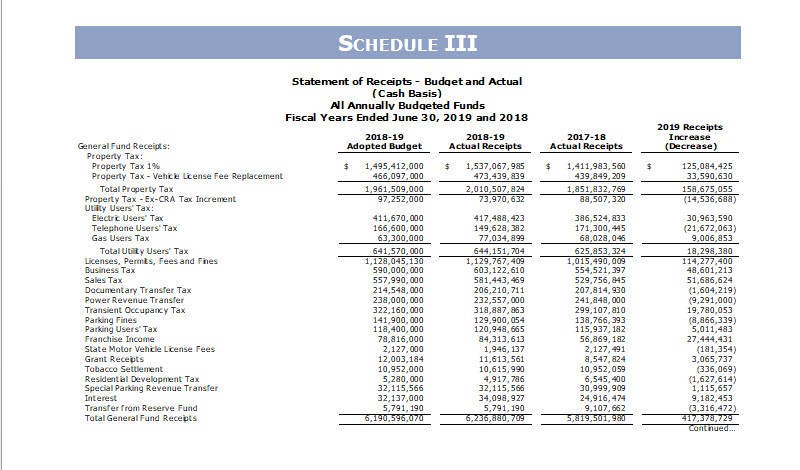
Schedule III: Statement of Receipts – Budget and Actual (Cash-Basis) – All Annually budgeted Funds
Schedule IV: Statement of Budget Appropriations, Expenditures and Encumbrances Budget and Actual (Cash-Basis) – All Annually Budgeted Funds
Schedule V: Year-end Encumbrances – General Fund
Schedule VI: General Fund Unencumbered Balances Reverted to the Reserve Fund
Schedule VII: General Fund Year-End Uncommitted Balances and Adopted Budget Reappropriations
Schedule VIII: Year-End Advances from the Reserve Fund for Unfunded Expenditures and Encumbrances
Schedule IX: Statement of General Obligation Bonded Debt
Schedule X: Ratio of Debt Service Requirement to General Fund Receipts Last Ten Fiscal Years